Dienstag, 21. Januar 2014

Diagnose OpenGL Performance Problems

I stumbled upon an interesting OpenGL slow down issue on stackoverflow.com: Curious slowdown in opengl when using instanced rendering. The author created a program which would render 20 x 20 x 20 cubes in two different ways: indexed drawing and instanced drawing. When using indexed drawing performance seemed fine. But after switching to instanced drawing it broke down. But only in a special case. As described by the question author: when the camera position changed the performance changed from decent (distance at 40) to horrible (distance at 0). This sounded strange.

First step to find a problem is to reproduce it. So I copied the example code, fixed small compiler issues, and created shaders which were referenced but missing in the question example code. They are simple so I guess the author used similar shaders.

Fragment shader for both drawing methods:
#version 330 core

in vec3 fragmentColor;
out vec3 color;

void main() {
  color = fragmentColor;
}
The vertex shader for basic indexed drawing:
#version 330 core

layout(location = 0) in vec3 vertexPosition;
layout(location = 1) in vec3 vertexColor;

out vec3 fragmentColor;
uniform mat4 MVP;

void main(){
  gl_Position = MVP * vec4((vertexPosition), 1);
  fragmentColor = vertexColor;
}
The vertex shader for instanced drawing:
#version 330 core

layout(location = 0) in vec3 vertexPosition;
layout(location = 1) in vec3 vertexColor;
layout(location = 2) in vec3 translation;

out vec3 fragmentColor;

uniform mat4 MVP;

void main(){
  gl_Position = MVP * vec4((vertexPosition + translation), 1);
  fragmentColor = vertexColor;
}
With those changes I was able to confirm the questions claim. The performance of the indexed drawing was fine. The performance of the instanced drawing method was horrible. It not only rendered extremely slowly it also stalled the whole computer. The cpu load was nearly at 0%. Since the program stalled the whole computer the bottleneck must have been either some kind of a system wide lock (either a software lock or hardware if form of a resource).

Next step was to create a system event trace file. This would not only tell me what the analysed program is doing but also how it interacts with the system. Windows 7 onwards has a very powerful event tracing system. The tools to create and analyse event traces are wprUI (Windows Performance Recorder) and wpaUI (Windows Performance Analyser). Both are part of the Windows 8.1 SDK. Here is a very nice blog if one wants to get down to details of performance analysing: randomascii.wordpress.com.

I enabled "GPU activity" and "Video glitches" profiles in wpr, recorded a session of the slow running program and opened it with GPUView. Also part of the Windows 8.1 SDK. The GPUView project site of Matt Fisher describes nicely how to read GPUView output. Here is a screen shot from GPUView's output generated from the recorded event trace:
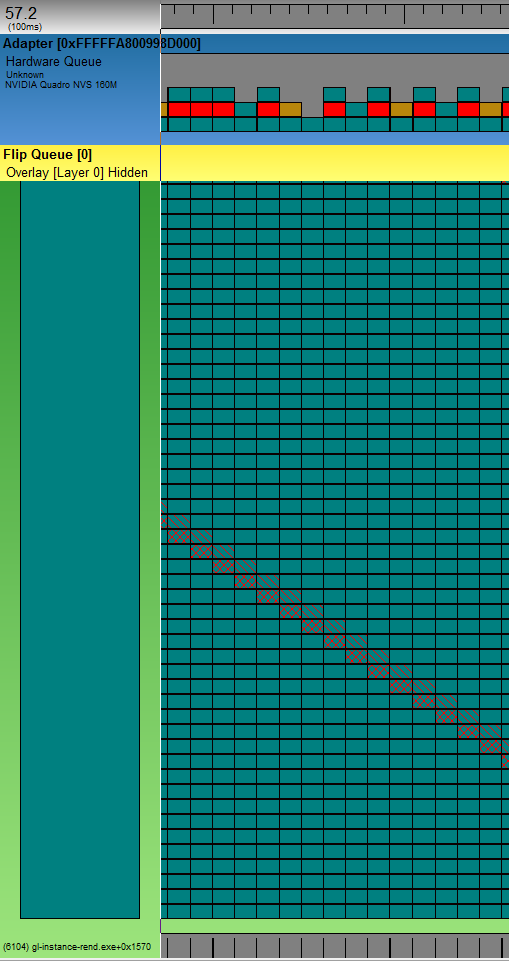

The light green lane is the test process having enormous rendering problems. The darker green parts are GPU command packets queued up in the process. The gray strip at the bottom is the CPU time consumed by the process. Since you see only thin black lines means the process is hardly consuming CPU time. But it heavily uses GPU. At the top you see a ruler. One tick of the ruler is about 100ms. The top blue lane is the graphics card and the hardware queue of command packets. The dark green packets are packets from the test process which are moved from software to hardware when there is room in the hardware queue. So it takes the GPU around 100ms to process one dark green packet!
The red packets are from the idle process and the brown from the dwm.exe process. Don't get confused by the size of the red and the brown packets. One needs to get used to the presentation type of GPUView. The packet in the pottom row of the hardware queue is the packet being processed. This packet determines the width of the whole (!) column. When it's the turn of the red and the brown packet to be processed, they are so fast, that you never see them in the bottom row. Here's a screen shot zoomed in onto one of those red packets:


The ruler ticks are now 1ms. Once it's turn for the red packet to be processed, it finishes in less than 1ms.

So we found out that the GPU is the bottleneck. The application hardly uses CPU but it creates heaps of GPU command packets and each packet takes ages (in terms of GPU time) to be processed. The question is why.

The next step in finding a problem is to reduce the complexity of the test. Reduce it as far as possible. Sometimes it's easier to restart from zero and add complexity until the problem occurs. This is what I did. I recreated the program step by step. First it drew small numbers of cubes with indexed drawing and instanced drawing. Then I added more and more cubes. GPUView confirmed that the number of command packets increased along with cube count. This was expected. But the execution time for each packet was around 0.8-3ms depending on the camera position (how many cubes were visible) but independent of the drawing style! Indexed drawing and instanced drawing were equally fast.

So my rewrite reached the complexity of the original program without triggering the problem. I started to replace parts of the original program with parts from my program. After I replaced the lattice calculation I noticed a strange cube right in the center of the grid. The grid in the original program was aligned in a way that the camera would face the center of a cube:

But in my rewrite I placed the camera between the rows and colums:


The strange cube was there in both versions. But in my rewrite it got visible. The performance dropped when the camera moved towards this cube.

I continued replacing parts of the program until the problem disappeared. And also the cube disappeared! I reverted my last change and realized that it was a bug in the code triggering the problem, not some strange OpenGL behaviour. This is the buggy line drawing the cubes:
glDrawElementsInstanced(GL_TRIANGLES, sqIndice.size(), GL_UNSIGNED_INT,
 (GLvoid*) (0), latticePoints.size());
This is the line from my rewrite:
glDrawElementsInstanced(GL_TRIANGLES, indices.size(), GL_UNSIGNED_INT,
 (GLvoid*)NULL, gridCoordinates.size()/3);
glDrawElementsInstanced expects the count of instances (cubes) to draw not the count of array elements. So instead of drawing 8000 cubes as it was meant to it drew 24000 cubes. But that's not the whole story. ;)

Let's remember the vertex shader. For each instance it reads three float values from the latticePoints array and stores them in the vec3 translation variable. Since OpenGL tried to draw far more instances than the latticePoints array was able to supply (latticePoints contained 24000 float elements, but OpenGL tried to access 24000*3=72000 elements). So this out of bounds situation would usually create a illegal memory access. Luckily there are facilities which prevent a shader from crashing. So instead of a crash the shader just received zero values. translation was set to (0,0,0) so no translation happened. This is explanation for the mysterious cube in the center. Or more exactly: the 16000 mysterious cubes in the center.

But why did it only perform so horribly when the camera moved towards the center cube? The vertices of the 16000 additional cubes did not make it so worse. I did some testing to come up with the solution for this. The program hits the graphic card memory speed limit. How's this? Here is what happens: Each fragment (pixel) painted by OpenGL has to be transferred to the graphic card memory. OpenGL prevents the most paints by not painting invisible parts. The depth buffer is very good at this task. But how about identical objects on exactly the same position? Is the front face of cube 8001 concealed by the front face of cube 8002 which is on the same position? It looks like OpengGL thinks it is not. So it paints all front faces of all 16000 cubes in the center. When the cube is far away this are not many pixels. But as the camera moves towards the center the front face of the cube covers more and more pixels. When the calculation time for one frame drops to 500ms the cube is roughly 250x250 pixels big. Let's do some math:

250 * 250 = 62,500 - amount of pixels to draw for one cube front face
62,500 * 16,000 = 1,000,000,000 - pixels to draw for all 16,000 cubes in the center
1,000,000,000 * 3 = 3,000,000,000 - 3 bytes are transferred for each pixel
3,000,000,000 * 2 = 6,000,000,000 - so many pixel per second (we have 2fps)

That's a lot. Let's see what my graphic cart is able to handle. I'm using a notebook with a Nvidia Quadro NVS 160M. Those are the specs:
  • Memory clock: 700 MHz
  • Memory bus bandwidth: 64bit
  • Memory type: GDDR2, GDDR3
 
700,000,000 * 8 = 5,600,000,000 - That's the clock multiplied by the bus bandwidth

So the NVS160M is able to move 5,6GBytes per second (I'm ignoring the memory type here for simplicity). According to the calculation above the program moves about 6GBytes per second. Don't nail me down to the numbers! Everything is approximately! But this little calculation points out that the memory speed is clearly on it's limit. I did other tests to verify this. I moved the 16000 cubes a little bit on the z axis so the fist one would conceal the others. The frame processing time dropped drastically (16ms per frame)! Then I disabled the depth buffer which kept OpenGL from drawing unnecessary pixels. There it was again the horrible performance. Then I created another small program which would just paint two triangles to form a square and let OpenGL paint it thousand times. It surely took long. For a full screen windows of a size of 800x600 the GPU required 400ms per frame. Nearly no geometry. Only 6000 vertices!

So here's the culprit: graphic card memory speed. Or: the bug. Depends on the perspective. ;)

For the vigilant reader of the original stackoverflow.com question: the enabled multisampling surely took it's tall also.


Donnerstag, 16. Januar 2014

Extract one folder from a Subversion repository into a GIT repository including complete history

This task is so common that there are a lot of articles and howtos on the net. This is mere a collection of information snippets and links to further reading. This article focuses on extracting a specific folder from a Subversion repository. This requirement seems to be untypical. All references I found assume the Subversion repository contains only one projects (including its branches and tags). But if in your case you placed all your projects in one Subversion repository, this article will tell you how you detach one.

Subversion to GIT conversion is done by the git svn command and it's sub commands. Pass the repository folder to git svn clone, and the command will clone the complete repository and complete history from revision 1. If you pass the full path to your project to the command (it doesn't matter if you pass the path as part of the repository path 'git svn clone http://svnserver/repo/trunk/myproject' or as trunk parameter 'git svn clone http://svnserver/repo -T trunk/myproject') it will clone the history from the revision on when your project folder was created. It doesn't care if your project contains files which are older than the project folder. For example: you restructured your project; once you had three modules:

  • "module1"
  • "module2"
  • "module3"

Then you created a new project folder "new project" and moved the modules into this folder:

  • "new project/module1"
  • "new project/module2"
  • "new project/module3"

Using the command above will ignore the history of the modules which is older than the "new project" folder. Even using --follow-parent will not get you the history, since "new project" has no parent, it was newly created. Sad.

Now let's check out how we get the complete history. I found two ways:

  • remove everything uninteresting from Subversion repository, and purge it from history
  • clone completely to GIT and remove/purge the uninteresting parts in GIT
To accomplish the first approach you'd need to use svnadmin dump (since there is no way to delete revisions from Subversion) to rebuild a repository while filtering the uninteresting files. I choose to use the second approach. And here's how you do it.

Clone Subversion Repository
From Git and Other Systems - Migrating to Git:
git svn clone http://svnserver/repo/ --authors-file=users.txt --no-metadata my_project
If anything goes wrong during cloning (for example your network connection dies, or you see a "unknown user" message) fix the problem and continue the process by invoking
git svn fetch
Remove Uninteresting Parts from GIT Repository
After successfully cloning the svn repository, we'd like to shrink down the repository to the project we'd like to keep. Before we do this, we need to convert the repository to a bare git repository. Bare git repositories are the only ones which are allowed to be pushed to. From my_project/.git move everything one level higher, so .git subdirectory ends up empty. Delete the empty .git directory. Now edit my_project/config and change "bare" setting to "true". After completing this you'll have a bare repository and we can continue to filter it.
From git: shrinking Subversion import:
git filter-branch -d /dev/shm/scratch --index-filter \
  "git rm -r --cached -f --ignore-unmatch 'Old Project'; \
   git rm -r --cached -f --ignore-unmatch 'Some Temp Stuff'; \
   git rm -r --cached -f --ignore-unmatch 'One More Project'" \
  --prune-empty --tag-name-filter cat -- --all
(choose a different temp folder for the -d parameter when not running on a up to date Linux)
git rm expects top level names. So the command above will remove the folders "/Old Project/", "/Some Temp Stuff/", "/One More Porject/" and everything that's below. You can specify folders on a deeper level like this:
git rm -r --cached -f --ignore-unmatch 'trunk/Delete-This-Project'
This syntax to git rm does no substring matching (folder names have to be complete). After this run the GIT repository will only contain the project you're interested in, including the whole history (assuming the history of your project does not intersect with folders you deleted).

Reduce Size of GIT Repository
GIT tries really hard not to delete stuff you might still need. So filter-branch will not reduce the size of your repository on disk. To remove all the deleted bits and bytes you also have to (copied from Detach subdirectory into separate Git repository):
git for-each-ref --format="%(refname)" refs/original/ | xargs -n 1 git update-ref -d
git reflog expire --expire=now --all
git gc --aggressive --prune=now

That's it. If everything went fine your GIT repository will contain only the stuff you're interested in.

Mittwoch, 18. Dezember 2013

Memory leaks even with WeakReferences

A crash report arrived at my desk the other day. The system crashed because it ran out of memory. And the major memory consumer was a WeakHashMap. Very interesting, since WeakHashMaps are usually used to allow to free memory when it's needed.

First some background. Imagine you've build a JSP page which generates a HTML page with a lot of URLs on it. You construct those URLs from different parameters. You use URLEncoder since you need valid URLs independent of the URL parameter contents you print. Once everything works fine, you realize that your URLs share may strings. So URLEncoder is called very often unnecessarily. You try to optimize the situation by creating a cache for URLEncoder:

class CachedUrlEncoder {
 static private Map<String, String> encodedMap = new HashMap<String,String>();

 public String encode(String str) {
  String encodedStr = encodedMap.get(str);
  if (encodedStr == null) {
   encodedStr = URLEncoder.encode(str);
   encodedMap.put(str, encodedStr);
  }
  return encodedStr;
 }
}

(The example is not thread save by purpose. We are not talking about concurrency, are we? ;) Also notice, that the one parameter encode method is now deprecated, because it uses system default encoding to encode the string.)

This cache would fill up the memory very quickly. It's never cleared after all. But there is also no special point in time when the cache should be cleared. The cached data never becomes outdated. Actually a cache should use a lot of memory if memory is not required by other subsystems, and free the memory if it becomes required. For this purpose the Java runtime has the SoftReference, WeakReference and the utility classes which use them. WeakHashMap f.e. is the perfect match for this scenario. A WeakHashMap references the values using normal hard references, and the keys using weak references. As soon as the key is not referenced any more (soft or hard) the whole entry will be freed. Here's the example rewritten to use WeakHashMap:


class CachedUrlEncoder {
 private static Map<String, String> encodedMap = new WeakHashMap<String,String>();

 public String encode(String str) {
  String encodedStr = encodedMap.get(str);
  if (encodedStr == null) {
   encodedStr = URLEncoder.encode(str);
   encodedMap.put(str, encodedStr);
  }
  return encodedStr;
 }
}

That was easy. Sadly you will notice at runtime that this code contains a memory leak. A not so obvious one. Let's analyse the situation.

As I mentioned already the map entries will be freed as soon as the key is not referenced by hard or soft references any more. In our case this should be immediately. After we've written the encoded string to the output stream of the JSP page, the string is not referenced any more. Still we're experiencing a memory leak. As so often the devil is in the details. The Sun implementation of URLEncoder.encode() tries to optimize by returning the reference to the string it received, if there is no encoding work to do. This is clever. It saves resources. But in this case this bit us really bad. If encode() returns the same reference the code will call Map.put() with the same reference as key and value. It'd look like:

encodedMap.put(str, str);

After that line the map has an entry with a weak reference to str and a hard reference to str. The entry itself prevents that it is garbage collected!

That's mean.

The fix is simple, once one knows the cause. We render the optimization of URLEncoder useless:

class CachedUrlEncoder {
 private static Map<String, String> encodedMap = new WeakHashMap<String,String>();

 public String encode(String str) {
  String encodedStr = encodedMap.get(str);
  if (encodedStr == null) {
   encodedStr = URLEncoder.encode(str);
   if (str == encodedStr) {
    encodedStr = new String(encodedStr);
   }
   encodedMap.put(str, encodedStr);
  }
  return encodedStr;
 }
}

Luckily the implementation of the string constructor is also smart. It does not copy the char data. A new string object is created and references the same char array as the old string. This is safe since strings are immutable. So the fix does create some overhead but not that much.

Montag, 16. Dezember 2013

A Executor is not a Thread - or: correct ThreadPoolExecutor error handling

Java 1.5 introduced the Executor framework. In summery: if you have some tasks (let's say: 20) and you want them to be processed in parallel by a couple of threads (let's say: 6), then a Executor is the solution you want to look for. But there are some surprising caveats which may lead to problems. And they are hard to diagnose.

Introduction

Executor is a interface. The ExecutorService interface extends Executor. One of the standard implementations of ExecutorService is ThreadPoolExecutor. This one manages some threads in a pool and executes the tasks you give it. You do this in form of a list of Runnable instances. A typical Runnable implementation looks like this:

public class MyWorker implements Runnable {
    private final Object data;

    public MyWorker(final Object data) {
        this.data = data;
    }

    @Override
    public void run() {
        process();
    }

    private void process() {
        // process data
    }
}

You initialize a ThreadPoolExecutor like this:

int nThreads = 8;
Executor executor = new ThreadPoolExecutor(nThread, nThreads, 0, TimeUnit.SECONDS, new LinkedBlockingQueue<Runnable>());

And since this is so cumbersome, there is a helper class for that:

int nThreads = 8;
Executor executor = Executors.newFixedThreadPool(nThreads);

This is how to use a Executor wrapped in a method:

public void executeRunnables(final List<Runnable> runnables) {
    int nThreads = 8;
    Executor executor = Executors.newFixedThreadPool(nThreads);
    for (final Runnable command : runnables) {
        executor.execute(command);
    }
}

This method would return to the caller immediately after creating the executor. But usually you want to wait until all the tasks have been processed before returning to the caller. For this purpose ExecutorService defines the methods shutdown() and awaitTermination():

public void executeRunnables(final List<Runnable> runnables) throws InterruptedException {
    final int nThreads = 8;
    final ExecutorService executor = Executors.newFixedThreadPool(nThreads);

    for (final Runnable command : runnables) {
        executor.execute(command);
    }

    executor.shutdown();

    executor.awaitTermination(2, TimeUnit.SECONDS);
}

(notice the change of executor type from Executor to ExecutorService) shutdown() puts the executor in "finish your work" mode. In this mode the executor will not accept new tasks. awaitTermination() waits until all threads processed all tasks. The time out takes care that your program doesn't wait forever if something goes wrong.

Error handling

So what if something goes wrong? What if one of your tasks throws an exception? How do you handle that? How do you even know something gone wrong? One possible approach is to catch and collect all exception inside the Runnable implementation:

public class MyRunnable implements Runnable {
    private final Object            data;
    private final List<Exception>   exceptions;

    public MyRunnable(final Object data, final List<Throwable> exceptions) {
        this.data = data;
        this.exceptions = exceptions;
    }

    @Override
    public void run() {
        try {
            process();
        } catch (final Exception ex) {
            exceptions.add(ex);
        }
    }

    private void process() {
        // process data
    }
}

But this approach has two major drawbacks: First, it would also catch the InterruptedException which may be used to control the thread under normal conditions. And second, the responsibility of error handling is moved to each Runnable implementation. You are going to implement a lot of Runnables and it's easy to forget something. Executor error handling calls for a generic solution.

Java 1.5 adds a method to register exception handlers for exactly this purpose: Thread.setUncaughtExceptionHandler(). Exceptions which are not handled by the run() method of the Thread implementation, will be forwarded to this handler. Let's modify the above example to use a exception handler:

/**
 * Implementation of a UncaughtExceptionHandler, which stores all exceptions in a List.
 */
private static class ExceptionCollector implements UncaughtExceptionHandler {
    final List<Throwable> exceptions = Collections.synchronizedList(new LinkedList<Throwable>());

    @Override
    public void uncaughtException(final Thread t, final Throwable e) {
        exceptions.add(e);
    }
}

/**
 * A ThreadFactory, which registers a UncaughtExceptionHandler.
 */
private static class ThreadWithUncaughtExHandlerFactory implements ThreadFactory {
    private final UncaughtExceptionHandler    exHandler;

    public ThreadWithUncaughtExHandlerFactory(final UncaughtExceptionHandler exHandler) {
        this.exHandler = exHandler;
    }

    @Override
    public Thread newThread(final Runnable r) {
        final Thread t = new Thread(r);
        t.setUncaughtExceptionHandler(exHandler);
        return t;
    }
}

public void executeRunnables(final List<Runnable> runnables) throws InterruptedException {
    final int nThreads = 8;
    // UnhandledExceptionHandler which will collect Exceptions:
    final ExceptionCollector exHandler = new ExceptionCollector();
    // create a executor with a custom Thread factory:
    final ExecutorService executor = Executors.newFixedThreadPool(nThreads,
                                       new ThreadWithUncaughtExHandlerFactory(exHandler));

    for (final Runnable command : runnables) {
        executor.execute(command);
    }

    executor.shutdown();

    executor.awaitTermination(2, TimeUnit.SECONDS);

    if (exHandler.exceptions.size() > 0) {
        // rethrow first of the collected exceptions
        throw new RuntimeException(exHandler.exceptions.size() +
                    " exceptions occured. First exception:", exHandler.exceptions.get(0));
    }
}


Now this looks good! If a exception is not handled by the Runnable implementations the Thread will get it and the Thread will pass it on to the uncaught exception handler. The handler will store it in the list for later usage. executeRunnables() waits until all Threads are done with work and checks the exception list then. If there is a entry it will be wrapped in a RuntimeException and rethrown. Instead of just passing the first exception, it's also possible to append the whole exception list to the thrown exception. This way the caller will be notified.

Or won't it?

Well, this article would probably not exist if everything would be that simple like it looks. The truth is: it doesn't work. At least not always. Which makes it even worse. Sometimes it works and sometimes it doesn't.

Problem analysis

A Thread is capable of processing only one Runable in general. When the Thread.run() method exits the Thread dies. The ThreadPoolExecutor implements a trick to make a Thread process multiple Runnables: it uses a own Runnable implementation. The threads are being started with a Runnable implementation which fetches other Runanbles (your Runnables) from the ExecutorService and executes them: ThreadPoolExecutor -> Thread -> Worker -> YourRunnable. When a uncaught exception occurs in your Runnable implementation it ends up in the finally block of Worker.run(). In this finally block the Worker class tells the ThreadPoolExecutor that it "finished" the work. The exception not yet arrived at the Thread class but ThreadPoolExecutor already registered the worker as idle.

And here's where the fun begins. The awaitTermination() method will be invoked when all Runnables have been passed to the Executor. This happens very quickly so that probably not any of the Runnables finished their work. A Worker will switch to "idle" if a exception occurs, before the Exception reaches the Thread class. If the situation is similar for the other threads (or if they finished their work), all Workers signal "idle" and awaitTermination() returns. The main thread reaches the code line where it checks the size of the collected exception list. And this may happen before any (or some) of the Threads had the chance to call the UncaughtExceptionHandler. It depends on the order of execution if or how many exceptions will be added to the list of uncaught exceptions, before the main thread reads it.

A very unexpected behaviour. But I won't leave you without a working solution. So let's make it work.

Correct solution

We are lucky that the ThreadPoolExecutor class was designed for extendibility. There is a empty protected method afterExecute(Runnable r, Throwable t). This will be invoked directly after the run() method of our Runnable before the worker signals that it finished the work. The correct solution is to extend the ThreadPoolExecutor to handle uncaught exceptions:

public class ExceptionAwareThreadPoolExecutor extends ThreadPoolExecutor {
    private final List<Throwable> uncaughtExceptions = 
                    Collections.synchronizedList(new LinkedList<Throwable>());

    @Override
    protected void afterExecute(final Runnable r, final Throwable t) {
        if (t != null) uncaughtExceptions.add(t);
    }

    public List<Throwable> getUncaughtExceptions() {
        return Collections.unmodifiableList(uncaughtExceptions);
    }
}


Sonntag, 15. Dezember 2013

Resolving circular dependencies in c++

I stumbled several times already upon situations where I created a circular dependency between two classes. Probably like every c++ developer. A circular dependency is bad design in general, it increases coupling between classes and thus makes changes more difficult (Circular dependency - Wikipedia). But in some languages (for example Java) it's possible to create classes which depend on each other without compiler errors. So very often circular dependencies are created and used without noticing. Differently for C++. The strict processing order of C++ compilers will spill out a bunch of errors when you try to make two classes depend on each other.
But you surely had a reason for this attempt. So how you achieve your aim whilst avoiding a circular dependency? See this example of a thread safe, usage based, load balanced object pool implementation:

// File: ObjectPool.h

#pragma once

#include <list>
#include <stdlib.h>
using namespace std;

// provides basic locking capabilities
#include "Lock.h"

// object type supplied by the pool
#include "Element.h"

class ObjectPool {
private:
 list<Element*> elements_;
 Lock lock_;

public:
 ObjectPool(size_t size) {
  for (size_t i = 0; i < size; i++) {
   elements_.push_back(new Element());
  }
 }

 Element *take() {
  // acquires the pool lock. AutoLockAndRelease will release the lock when scope is left
  AutoLockAndRelease autoLock(lock_);

  Element *chosen = getLeastUsedElement();
  chosen->incUsageCount();
  return chosen;
 }

 void release(Element *element) {
  AutoLockAndRelease autoLock(lock_);

  assertThisIsOurElement(element);
  element->decUsageCount();
 }

private:
 // checks if this element belongs to this pool
 void assertThisIsOurElement(Element *element) {
  // implementation details omitted
 }

 Element *getLeastUsedElement() {
  // implementation details omitted
 }
};


// File: Element.h

#pragma once

class Element {
private:
 int usageCount_;

public:
 Element():usageCount_(0) {
 }

 void incUsageCount() {
  usageCount_++;
 }

 void decUsageCount() {
  usageCount_++;
 }

 int getUsageCount() {
  return usageCount_;
 }
};


This is how it'd be used:

ObjectPool pool(5);
Element *element = pool.take();
// use element
pool.release(element);

I spare you the implementation details of Lock.h. Just assume it contains a lock implementation capable of synchronizing threads.

I'd like to modify this object pool and add the capability to the element to release itself. Id' like to use the pool like this:

ObjectPool pool(5);
Element *element = pool.take();
// use element
element.release();

Here are the code changes implementing this feature:

// File: ObjectPool.h

 ...
public:
 ObjectPool(size_t size) {
  for (size_t i = 0; i < size; i++) {
   elements_.push_back(new Element(*this));
  }
 }

 ...


// File: Element.h
...
class Element {
private:
 int usageCount_;
 ObjectPool &parent_;

public:
 Element(ObjectPool &parent):usageCount_(0), parent_(parent) {
 }

 ...

 void release() {
  parent_.release(this);
 }
};

This example suffers from two problems:
  1. A a very subtle problem: The reference to the ObjectPool instance is made public to the Entry instance before the constructor of the ObjectPool class finished initializing the instance. This is known as early reference leak and should be avoided (Java theory and practice: Safe construction techniques, Should you use the this pointer in the constructor?).
  2. The obvious one: The example doesn't compile. My compiler issues the error "'ObjectPool' does not name a type". This arises from the attempt to create a circular dependency: ObjectPool depends on Element, and Element depends on ObjectPool.
Let's first have a look at what we actually are trying to achieve here. The ObjectPool class manages a specified amount of entries. For each entry a usage count is maintained. The user can call take() to receive the entry with the lowest usage count. The ObjectPool class will use a lock to synchronize take() and release() invocations so it can be used safely in a threaded context. Once the user is done using a entry he invokes release() on the entry which then invokes release() on its parent which does a synchronized release. So how do we resolve the circular dependency while preserving the logic?

The solution is to decouple the ObjectPool and the Element class. I'll show here how to decouple both using a interface. The idea is, the Element class doesn't has to know the whole implementation of the ObjectPool class. It only needs to know the release() method. So we create a interface containing the release method and let ObjectPool implement the interface. Then we tell Entry only about the interface but not the ObjectPool class.

Here is the interface:

// File: Releaser.h

#pragma once

template<typename T>
class Releaser {
public:
 virtual ~Releaser() {};
 virtual void release(T *element) = 0;
};

It defines a single release method with a template type. The template type is essential here. Without the use of a template the interface would need to include Element type to use it as parameter type. But this would again create a circular dependency: ObjectPool -> Releaser -> Element -> Releaser. Using the template trick we break the cycle. Here are the modified implementations of ObjectPool and Element.

// File: ObjectPool.h

#pragma once

#include 
#include 
using namespace std;

#include "Lock.h"
#include "Element.h"
#include "Releaser.h"

class ObjectPool: public Releaser {
private:
 list elements_;
 Lock lock_;

public:
 ObjectPool(size_t size) {
  for (size_t i = 0; i < size; i++) {
   elements_.push_back(new Element(*this));
  }
 }

 Element *take() {
  AutoLockAndRelease autoLock(lock_);

  Element *chosen = getLeastUsedElement();
  chosen->incUsageCount();
  return chosen;
 }

 void release(Element *element) {
  AutoLockAndRelease autoLock(lock_);

  assertThisIsOurElement(element);
  element->decUsageCount();
 }

private:
 void assertThisIsOurElement(Element *element) {
  // implementation details omitted
 }

 Element *getLeastUsedElement() {
  // implementation details omitted
 }
};


// File: Element.h

#pragma once

#include "Releaser.h"

class Element {
private:
 int usageCount_;
 Releaser &releaser_;

public:
 Element(Releaser &releaser):usageCount_(0), releaser_(releaser) {
 }

 void incUsageCount() {
  usageCount_++;
 }

 void decUsageCount() {
  usageCount_++;
 }

 int getUsageCount() {
  return usageCount_;
 }

 void release() {
  releaser_.release(this);
 }
};


Now Element only references Releaser and the dependency cycle is broken.

Mittwoch, 20. November 2013

Linux Process Memory Layout

This article describes how the memory structure of each Linux process does look like.
Each Linux process starts with several memory blocks. A code block to hold the executable code of the program, stack blocks (one for each thread) and several data blocks (one for constants of the program, one for dynamic usage). Sometimes those blocks are called segments. In case of the data blocks we'll call them arenas in this article. This initial arena block is called the main arena. You'll see it named as "[heap]" in the contents of /proc/xxx/maps of any Linux process (replace xxx by PID).

Basics


A Linux program can use the system functions brk()/sbrk() to change the size of it's main arena. It can also use mmap() to get new arenas from the system. But usually progams will use a memory management library instead of the system functions. The memory management library which is used by default is the libc library. One can override this, but usually all linux processes use this library. It exports functions like malloc(), realloc(), calloc(), free() to the program. The program uses those to allocate and free memory. And the memory management library itself uses brk(), sbrk(), mmap() to allocate the memory from the system.

libc creates data structures inside of the arenas to split the arena in smaller blocks. We'll call this structures "heap". So arenas are huge blocks issued by the system to libc. Heaps are the data structures inside this arenas (yes, there are several heaps) to manage smaller blocks.

Java/JNI memory layout

But a process doesn't have to use the libc functions. Java for example has it's own memory management functions. Java starts just like every other linux process. But then it uses mmap() to allocate memory for it's own Java heap (and for the other Java memory areas, like PermGenSpace for classes or code cache for the JIT compiler) according to the size settings ("-Xmx" and others). All the memory which is used by Java objects and classes is *not* managed by libc. But Java has also parts which are implemented in native (JNI) code. If this native code requires memory it will use libc functions. Also (JNI) libraries loaded by Java are just like the Java native part, they also use libc functions.

Difference vss/rss

When using several Linux tools, which do report memory usage (ps/top), you will stumble upon the two TLAs: vss, rss. (aliases are: vsz, rsz) They mean:
  • Virtual Set Size 
  • Resident Set Size 
They exist to name two different memory allocation types. vss names the reserved address space. Rss names the physical allocated memory (simplefied, see Details For The Hard Core Developer 1). One could (theoretically) allocate 16.777.216 terabytes of address space without using even one byte of physical memory. Only when the program asks the system to allocate physical memory, physical memory is allocated (simplified, see Dnowledge For The Hard Core Developer 2). How does the system tell between address space allocation and physical memory allocation? When the process allocates memory from the system it passes access permission to mmap():


// mmap() syntax: void *mmap(void *addr, size_t length, int prot, int flags, int fd, off_t offset);

void *block1;
// this will allocate 200 bytes without any access permissions at a starting address choosen by the system
block1 = mmap(NULL, 200, PROT_NONE, MAP_PRIVATE, 0, 0);

This is just a address space reservation. The address space starting at block1 and spanning 200 bytes will not be issued at any other mmap() call. How does a process allocate physical memory? By changing the access permissions:

// syntax of mprotect(): int mprotect(const void *addr, size_t len, int prot);
mprotect(block1, 100, PROT_READ | PROT_WRITE); 

After this invocation the first 100 bytes will be available for read and write. The remaining 100 bytes will still be just reserved address space.

But why we need to reserve address space anyway? If you are curious, see "Details For The Hard Core Developer 3".

How libc Manages Memory

As already said, the system allocates the main arena block for each process at process start up. libc creates a heap data structure inside of this main arena block. This is the main heap. libc supports multi threaded programs. So invoking the memory functions in parallel is possible. Like any other program, libc has to use locking to guarantee data structure integrity while several threads call libc functions at the same time. To increase performance, libc tries to reduce lock contention (lock blocking) by having one lock per heap and by creating more heaps. When a memory request arrives at libc, it tries to lock the heap which was last used by the thread. If the thread did not use any heap yet, libc tries to lock the main heap. If locking fails, libc tries the next existing heap. If all heaps have been tested, libc creates a new heap. A heap is created by requesting a new arena from the system (mmap()) and writing heap structures into it:

void *arena;
// reserves 64MB address space. libc heaps start always at 64MB size.
arena = mmap(NULL, 64*1024*1024, PROT_NONE, MAP_PRIVATE, 0, 0);
// allocate necessary memory at the beginning of heap
mprotect(arena, 1000, PROT_READ | PROT_WRITE);
// after this invocation libc can use the first 1000 bytes of the reserved address space 

When a heap was successfully locked, libc tries to find a free block which does satisfy the requested size. If a block was found, it is returned. If no block was found, libc tries to increase the size of the heap. It can do this in two ways.
  1. Allocating bytes in the reserved address space (by calling mprotect() and increasing the area which has read/write permissions in the arena). This can only succeed if there is still room to expand.
  2. Increasing address space and allocating bytes there (By calling mremap(), which will assign more address space. Heaps are resized in 64MB steps.). This can only succeed if the address space bordering the end of the current arena is still free.
If both fail (arena is full, arena cannot be resized) a new heap will be created. So heaps are created in two cases: to satisfy memory needs, to reduce lock contention.

How can we use this knowledge to optimize the memory footprint of our program? Let's assume we have a process with 100 threads. And let's assume there is heavy load, so all 100 threads call libc at the same time. In this case libc will create 100 heaps, each of 64MB in size. (vss will instantly increase to 6,4GB, but rss will remain low, because the physical memory is not allocated yet.) This sounds not so bad yet (rss is still low). But let's continue this horror scenario. Let's assume this heavy load led to full exhaustion of the available memory. All 100 heaps are full. But the load stopped and the used memory is freed. Nearly everything is freed just some small blocks remain (which for example are used as a thread local buffer). Unluckily these buffers were allocated late, so that they lay at the "end" of the heap. The heap is nearly empty, just at the end there is this small block. libc is capable of shrinking the heaps to return memory to the system. If the free block at the end of the heap is big enough, libc shrinks the heap. But since there is a used block, libc cannot do this. The heap cannot have gaps. So even if the memory is not used by the program the rss and vss of the program will remain at 6,4GB.

So what do we learn from this? Don't use more threads than necessary. After all not all of those threads can run truly parallel. The system is limited to a much smaller number of CPU cores. Often waiting for resources is compensated by having more threads. If it's network resources, try to switch to asynchronous processing so the thread can do some other work, while the network interface is processing data. This way you will be able to reduce the number of required threads. The other thing we learned: If you use buffers, do free those buffers sometimes (This only applies for unmanaged languages like C. Java is able to move it's memory blocks to reduce fragmentation.).

/proc/xxx/maps

Everyone can have a look at the blocks issued by the sytem to the program. The file maps in the proc folder of each process contains this information. the contents look like this (example of bash process):

00400000-004e1000 r-xp 00000000 fc:00 524291                             /bin/bash
006e0000-006e1000 r--p 000e0000 fc:00 524291                             /bin/bash
006e1000-006ea000 rw-p 000e1000 fc:00 524291                             /bin/bash
006ea000-006f0000 rw-p 00000000 00:00 0
00ec7000-01224000 rw-p 00000000 00:00 0                                  [heap]
7fc285b08000-7fc285b14000 r-xp 00000000 fc:00 6419                       /lib/x86_64-linux-gnu/libnss_files-2.15.so
7fc285b14000-7fc285d13000 ---p 0000c000 fc:00 6419                       /lib/x86_64-linux-gnu/libnss_files-2.15.so
7fc285d13000-7fc285d14000 r--p 0000b000 fc:00 6419                       /lib/x86_64-linux-gnu/libnss_files-2.15.so
7fc285d14000-7fc285d15000 rw-p 0000c000 fc:00 6419                       /lib/x86_64-linux-gnu/libnss_files-2.15.so
7fc285d15000-7fc285d1f000 r-xp 00000000 fc:00 5919                       /lib/x86_64-linux-gnu/libnss_nis-2.15.so
7fc285d1f000-7fc285f1f000 ---p 0000a000 fc:00 5919                       /lib/x86_64-linux-gnu/libnss_nis-2.15.so
7fc285f1f000-7fc285f20000 r--p 0000a000 fc:00 5919                       /lib/x86_64-linux-gnu/libnss_nis-2.15.so
7fc285f20000-7fc285f21000 rw-p 0000b000 fc:00 5919                       /lib/x86_64-linux-gnu/libnss_nis-2.15.so
7fc285f21000-7fc285f38000 r-xp 00000000 fc:00 6429                       /lib/x86_64-linux-gnu/libnsl-2.15.so
7fc285f38000-7fc286137000 ---p 00017000 fc:00 6429                       /lib/x86_64-linux-gnu/libnsl-2.15.so
7fc286137000-7fc286138000 r--p 00016000 fc:00 6429                       /lib/x86_64-linux-gnu/libnsl-2.15.so
7fc286138000-7fc286139000 rw-p 00017000 fc:00 6429                       /lib/x86_64-linux-gnu/libnsl-2.15.so
7fc286139000-7fc28613b000 rw-p 00000000 00:00 0
7fc28613b000-7fc286143000 r-xp 00000000 fc:00 6433                       /lib/x86_64-linux-gnu/libnss_compat-2.15.so
7fc286143000-7fc286342000 ---p 00008000 fc:00 6433                       /lib/x86_64-linux-gnu/libnss_compat-2.15.so
7fc286342000-7fc286343000 r--p 00007000 fc:00 6433                       /lib/x86_64-linux-gnu/libnss_compat-2.15.so
7fc286343000-7fc286344000 rw-p 00008000 fc:00 6433                       /lib/x86_64-linux-gnu/libnss_compat-2.15.so
7fc286344000-7fc2867c2000 r--p 00000000 fc:00 531094                     /usr/lib/locale/locale-archive
7fc2867c2000-7fc286977000 r-xp 00000000 fc:00 6434                       /lib/x86_64-linux-gnu/libc-2.15.so
7fc286977000-7fc286b76000 ---p 001b5000 fc:00 6434                       /lib/x86_64-linux-gnu/libc-2.15.so
7fc286b76000-7fc286b7a000 r--p 001b4000 fc:00 6434                       /lib/x86_64-linux-gnu/libc-2.15.so
7fc286b7a000-7fc286b7c000 rw-p 001b8000 fc:00 6434                       /lib/x86_64-linux-gnu/libc-2.15.so
7fc286b7c000-7fc286b81000 rw-p 00000000 00:00 0
7fc286b81000-7fc286b83000 r-xp 00000000 fc:00 6432                       /lib/x86_64-linux-gnu/libdl-2.15.so
7fc286b83000-7fc286d83000 ---p 00002000 fc:00 6432                       /lib/x86_64-linux-gnu/libdl-2.15.so
7fc286d83000-7fc286d84000 r--p 00002000 fc:00 6432                       /lib/x86_64-linux-gnu/libdl-2.15.so
7fc286d84000-7fc286d85000 rw-p 00003000 fc:00 6432                       /lib/x86_64-linux-gnu/libdl-2.15.so
7fc286d85000-7fc286da9000 r-xp 00000000 fc:00 340                        /lib/x86_64-linux-gnu/libtinfo.so.5.9
7fc286da9000-7fc286fa8000 ---p 00024000 fc:00 340                        /lib/x86_64-linux-gnu/libtinfo.so.5.9
7fc286fa8000-7fc286fac000 r--p 00023000 fc:00 340                        /lib/x86_64-linux-gnu/libtinfo.so.5.9
7fc286fac000-7fc286fad000 rw-p 00027000 fc:00 340                        /lib/x86_64-linux-gnu/libtinfo.so.5.9
7fc286fad000-7fc286fcf000 r-xp 00000000 fc:00 6422                       /lib/x86_64-linux-gnu/ld-2.15.so
7fc2871b3000-7fc2871c1000 r--p 00000000 fc:00 265459                     /usr/share/locale-langpack/de/LC_MESSAGES/bash.mo
7fc2871c1000-7fc2871c4000 rw-p 00000000 00:00 0
7fc2871c6000-7fc2871cd000 r--s 00000000 fc:00 535727                     /usr/lib/x86_64-linux-gnu/gconv/gconv-modules.cache
7fc2871cd000-7fc2871cf000 rw-p 00000000 00:00 0
7fc2871cf000-7fc2871d0000 r--p 00022000 fc:00 6422                       /lib/x86_64-linux-gnu/ld-2.15.so
7fc2871d0000-7fc2871d2000 rw-p 00023000 fc:00 6422                       /lib/x86_64-linux-gnu/ld-2.15.so
7fff98beb000-7fff98c0c000 rw-p 00000000 00:00 0                          [stack]
7fff98d48000-7fff98d49000 r-xp 00000000 00:00 0                          [vdso]
ffffffffff600000-ffffffffff601000 r-xp 00000000 00:00 0                  [vsyscall]

The columns are:
  • Address range of the block
  • access permissions
  • offset into the file, if block is a memory mapped file
  • device number (of mapped file)
  • inode (of mapped file)
  • name of block or name of file (if mapped)
    The tool pmap can display the same information in a more readable format. About identifying single blocks: "Details For The Hard Core Developer 4".

    Tools

    I've written a tool to read the maps of a java process and guess the role of the different blocks. The tools is committed here: javaJniMemUsage.pl. It runs intrusion less on a server with very limited prerequisites (only Perl and Linux).

    javaJniMemUsage.pl [OPTIONS] PID|proc-maps-file
      OPTIONS
       -c - print output as CSV
       -h - print CSV header line before data line
      PID - process id of process to retrieve memory maps information.
      proc-maps-file - contains memory maps information. Can be directly /proc/PID/maps.
    

    One can invoke the tool with a pid, in which case the tool will read /proc/PID/maps, or a file which contains a maps dump. Without any other parameters the tool will dump a human readable output.


    Here is a sample output of a busy java application server:

    7f2096bf9000 -      5066752 (   4M 852K), rw-p, 0,
    7f20973b6000 -      5066752 (   4M 852K), rw-p, 0,
    7f2097b73000 -      5066752 (   4M 852K), rw-p, 0,
    7f2098330000 -      5066752 (   4M 852K), rw-p, 0,
    7f2098aed000 -      5066752 (   4M 852K), rw-p, 0,
    7f20bc2fc000 -      5066752 (   4M 852K), rw-p, 0,
    7f20d8327000 -      5066752 (   4M 852K), rw-p, 0,
    7f20f8327000 -      5066752 (   4M 852K), rw-p, 0,
    7f21161fb000 -      2703360 (   2M 592K), rw-p, 0,
    7f2116778000 -      2703360 (   2M 592K), rw-p, 0,
    7f2116cf5000 -      2703360 (   2M 592K), rw-p, 0,
    7f2117272000 -      2703360 (   2M 592K), rw-p, 0,
    7f21177ef000 -      2703360 (   2M 592K), rw-p, 0,
    7f2117d6c000 -      2703360 (   2M 592K), rw-p, 0,
    7f211c551000 -      2703360 (   2M 592K), rw-p, 0,
    7f211cce3000 -      2703360 (   2M 592K), rw-p, 0,
    7f21205d6000 -         8192 (        8K), rw-p, 0,
    7f21211ef000 -        12288 (       12K), ---p, 0,
    7f21211f2000 -      2088960 (  1M 1016K), rw-p, 0, [stack:28219]
    7f2121ed4000 -        16384 (       16K), rw-p, 0,
    7f2122182000 -         4096 (        4K), rw-p, 0,
    7f2122604000 -         8192 (        8K), rw-p, 0,
    7f2122f6f000 -         8192 (        8K), rw-p, 0,
    7f21236c6000 -        12288 (       12K), rw-p, 0,
    7f2123b89000 -       151552 (      148K), rw-p, 0,
    7f2128000000 -         4096 (        4K), r--p, 0,
    7f212801f000 -      1540096 (   1M 480K), rw-p, 0,
    7f2128d82000 -         4096 (        4K), ---p, 0,
    7f2128d83000 -     10731520 (  10M 240K), rw-p, 0, [stack:28198]
    7f212a058000 -         4096 (        4K), ---p, 0,
    7f212a059000 -      1208320 (   1M 156K), rw-p, 0, [stack:28190]
    7f212a180000 -       118784 (      116K), ---p, 0,
    7f212a19d000 -       770048 (      752K), rw-p, 0,
    7f212a259000 -      8003584 (   7M 648K), rw-p, 0,
    7f212a9fb000 -        36864 (       36K), ---p, 0,
    7f212aa04000 -       348160 (      340K), rw-p, 0,
    7f212aa59000 -       159744 (      156K), rw-p, 0,
    7f212aa80000 -       118784 (      116K), ---p, 0,
    7f212aa9d000 -       770048 (      752K), rw-p, 0,
    7f212ab59000 -      8003584 (   7M 648K), rw-p, 0,
    7f212b2fb000 -        36864 (       36K), ---p, 0,
    7f212b304000 -       348160 (      340K), rw-p, 0,
    7f212b359000 -      3526656 (   3M 372K), rw-p, 0,
    7f212b6b6000 -       667648 (      652K), ---p, 0,
    7f212b759000 -         4096 (        4K), rw-p, 0,
    7f212b75a000 -     17432576 (  16M 640K), rwxp, 0,
    7f212c7fa000 -     32899072 (  31M 384K), rw-p, 0,
    7f212f196000 -         8192 (        8K), rw-p, 0,
    7f212ff6b000 -        86016 (       84K), rw-p, 0,
    7f2130b39000 -       167936 (      164K), rw-p, 0,
    7f2130ee7000 -        20480 (       20K), rw-p, 0,
    7f213150c000 -        16384 (       16K), rw-p, 0,
    7f2131747000 -       438272 (      428K), rw-p, 0,
    7f21317b2000 -       512000 (      500K), rw-p, 0,
    7f2131837000 -        12288 (       12K), ---p, 0,
    7f213183a000 -      1060864 (    1M 12K), rw-p, 0, [stack:28189]
    7f2131942000 -         4096 (        4K), rw-p, 0,
    7f2131943000 -         4096 (        4K), r--p, 0,
    7f2131944000 -         8192 (        8K), rw-p, 0,
    7f2131948000 -         4096 (        4K), rw-p, 0,
    7fff955d3000 -       135168 (      132K), rw-p, 0, [stack]
    Java-Blocks =
           count=8
            addr=[660000000,664df0000,668650000,680000000,774220000,7755e0000,780000000,7eb830000]
             rss= 6G 108M 64K
             vsz= 6G 512M
    sizeInMappedFiles =  142M 536K
    sizeInSystemMappings =  8K
    main-arena =  1G 528M 244K
    stacks =
         1M
           count=8
             rss= 8M
             vsz= 8M 32K
      1016K
           count=72
             rss= 71M 448K
             vsz= 72M 288K
         8M
           count=179
             rss= 1G 408M
             vsz= 1G 408M 716K
    libc arenas =
       128M
           count=18
            addr=[7f1f00000000,7f1f90000000,7f1fa8000000,7f1fb0000000,7f1fc8000000,7f1fd8000000,7f1fe0000000,7f1ff8000000,7f2000000000,7f2008000000,7f2010000000,7f2030000000,7f2048000000,7f2050000000,7f2058000000,7f2064000000,7f20dc000000,7f20fc000000]
             rss= 2G 192M 556K
             vsz= 2G 256M
        64M
           count=65
            addr=[7f1ef8000000,7f1f08000000,7f1f10000000,7f1f14000000,7f1f18000000,7f1f1c000000,7f1f20000000,7f1f28000000,7f1f2c000000,7f1f30000000,7f1f34000000,7f1f38000000,7f1f3c000000,7f1f40000000,7f1f44000000,7f1f48000000,7f1f4c000000,7f1f54000000,7f1f58000000,7f1f5c000000,7f1f60000000,7f1f64000000,7f1f6c000000,7f1f74000000,7f1f78000000,7f1f7c000000,7f1f80000000,7f1f84000000,7f1f88000000,7f1f8c000000,7f1f98000000,7f1f9c000000,7f1fa0000000,7f1fa4000000,7f1fb8000000,7f1fc0000000,7f1fd0000000,7f1fd4000000,7f1fe8000000,7f1ff0000000,7f1ff4000000,7f2018000000,7f201c000000,7f2020000000,7f2024000000,7f2028000000,7f202c000000,7f2038000000,7f203c000000,7f2040000000,7f2060000000,7f206c000000,7f2070000000,7f2084000000,7f20b8000000,7f20d4000000,7f20e4000000,7f20e8000000,7f20ec000000,7f20f4000000,7f2104000000,7f2108000000,7f2110000000,7f2118000000,7f2124000000]
             rss= 3G 861M 148K
             vsz= 4G 64M
    unknown rss = 145M 616K, vsz =  146M 580K
    sum rss = 15G 275M 28K, vsz = 16G 90M 356K
    

    First it dumps a list of blocks it was not able to identify. (The format changes slightly. Instead of the end address, the size of the block is printed.) The size of this blocks is summed up at the bottom: "unknown rss". This should be a small number. After that, it dumps categories of blocks it did identify. Each category is grouped into paragraphs of same size. Each size paragraph contains the number of blocks found and the size sum occupied by those blocks. Size sum is always split into vsz (vss) and rss. vsz includes rss, this is why it will be always bigger. Some size paragraphs print also addresses of the identified blocks. They can be usually ignored. "sum rss" and "sum vsz" finally is the sum of all the blocks. They should be the same like reported by ps/top.

    In the sample output before, we see that the 15GB rss are mainly used in this categories:
    • Java takes 6GB, exactly as specified by java parameters (-Xmx6g).
    • Thread stacks consume 1,5GB!
    • And finally the native heaps consume 7,5GB split into 83 heaps and one main arena/heap.

      Details For The Hard Core Developer

      1. Rss includes the size of shared libraries mapped into memory. While this really uses physical memory, this memory is shared between processes using the same shared library. So if one process loades a 5MB shared library, rss for this process will be 5MB + the process ofwn stuff. If 10 processes load the same 5MB shared library, the rss for each process will be 5MB + the process stuff. But only 5MB of physical memory was really spent. So rss is not exactly physical memory size.
      2. Even if the system grants "physical" memory to the process it does not waste the memory yet. Two processes could allocate each the size of the whole system memory (assumed there is enough swap space) without anything bad happening. The system splits the memory into pages. And only if a process starts to access the memory, the page where the access is inside is considered "dirty" and backed by physical memory.
      3. This is necessary so libc can get a huge block from the system, without blocking memory which is not yet used. But why should we use libc and not just allocate memory by using mmap() instead? There are several reasons: 1. The memory returned by mmap() is aligned at page boundaries. The page size is usually 4kB. So if we allocate 10 bytes the rest of the page address space (4086 bytes) will be wasted. Since the system manages memory in pages this means real memory will be wasted. So we need libc to manage small memory blocks with smaller alignments. 2. There is a limited number of blocks which the system can return using mmap(). Since some processes use millions of memory blocks this would exhause this resource very quickly.
      4. We can guess three types of memory blocks in Java programs. 1. the Java blocks, 2. libc heaps, 3. stacks. Java blocks are usually at the beginning of the list and are huge. Their size equals the specified block sizes (-Xmx, -XX:PermGenSpace). The size may be split into several blocks. Especially into two blocks where one has read/write access and the other no access permissions (this is the growing heap). libc heaps have a size of exactly 64MB (64*1024*1024MB) or a magnitude of that (128MB, 192MB, ...). Each heap block is also split in two blocks with different access permissions. If the heap is full, there is only one block. Stacks have also a noticeable size. They are usually a magnitude of exactly 1MB. 1MB and 8MB stacks have been those I've seen the most in Java programs. Stacks have something more special: stack blocks are always preceeded by a guarding block. The guarding block is the size of one page (4k) and has no access premissions. This is used to detect stack overflows. The guarding block preceeds the stack block because stacks grow from bigger addresses to smaller addresses. If the stack overflows, the code will access the address space of this block without access permissions.
      5. Further deep detail reading: http://www.blackhat.com/presentations/bh-usa-07/Ferguson/Whitepaper/bh-usa-07-ferguson-WP.pdf

      It’s not my code! I googled it.

      Actually this blog post is not about Google. And it is even not about copying code. But it is indeed about code which I did not write. Since a couple days we use Sonar to check our code for coding style or conventions violations. Well this is not that new. We used to use Checkstyle, PMD, Findbugs already for a couple of years. But the switch to Sonar brought the heap of violations in our code up my mind again. Sonar says we have around 3000-5000 violations in our projects. Probably the most of them are eligible. But some of them are not:


      Here you see some of the violations found in the Configuration class in the equals() method. Nearly each line has a violation. The problem is: equals() is a automatically generated method. Coding conventions violations in generated code are just useless. Generated code doesn’t has to be maintainable. It doesn’t has to be readable.

      I thought about how to tell Sonar to ignore this code. One could use the //NOSONAR comment to make Sonar ignore lines. But you’d have to place it on every line. Or you could use

      @SuppressWarnings("all")

      but this would suppress all warnings, not only Sonar violations (reference).

      Then I stumbled upon @Generated annotation which is part of Java since 1.6. Using this annotation, code generators could automatically mark generated code, making life easier for code analyzers and developers. So in a perfect world my Eclipse code generator would generate this method:

      @Override
      @Generated("Eclipse source generator")
      public boolean equals(final Object obj) {
       if (this == obj) return true;
       if (obj == null) return false;
       if (getClass() != obj.getClass()) return false;
       final ConfigurationBase other = (ConfigurationBase) obj;
       if (autoRefreshDatabaseEnabled != other.autoRefreshDatabaseEnabled) return false;
       ....
      }

      and all code analyzers would magically ignore this method.

      This idea was already picked up by the sonar team but sadly not yet implemented.