I stumbled upon an interesting OpenGL slow down issue on stackoverflow.com: Curious slowdown in opengl when using instanced rendering. The author created a program which would render 20 x 20 x 20 cubes in two different ways: indexed drawing and instanced drawing. When using indexed drawing performance seemed fine. But after switching to instanced drawing it broke down. But only in a special case. As described by the question author: when the camera position changed the performance changed from decent (distance at 40) to horrible (distance at 0). This sounded strange.
First step to find a problem is to reproduce it. So I copied the example code, fixed small compiler issues, and created shaders which were referenced but missing in the question example code. They are simple so I guess the author used similar shaders.
Fragment shader for both drawing methods:
Next step was to create a system event trace file. This would not only tell me what the analysed program is doing but also how it interacts with the system. Windows 7 onwards has a very powerful event tracing system. The tools to create and analyse event traces are wprUI (Windows Performance Recorder) and wpaUI (Windows Performance Analyser). Both are part of the Windows 8.1 SDK. Here is a very nice blog if one wants to get down to details of performance analysing: randomascii.wordpress.com.
I enabled "GPU activity" and "Video glitches" profiles in wpr, recorded a session of the slow running program and opened it with GPUView. Also part of the Windows 8.1 SDK. The GPUView project site of Matt Fisher describes nicely how to read GPUView output. Here is a screen shot from GPUView's output generated from the recorded event trace:
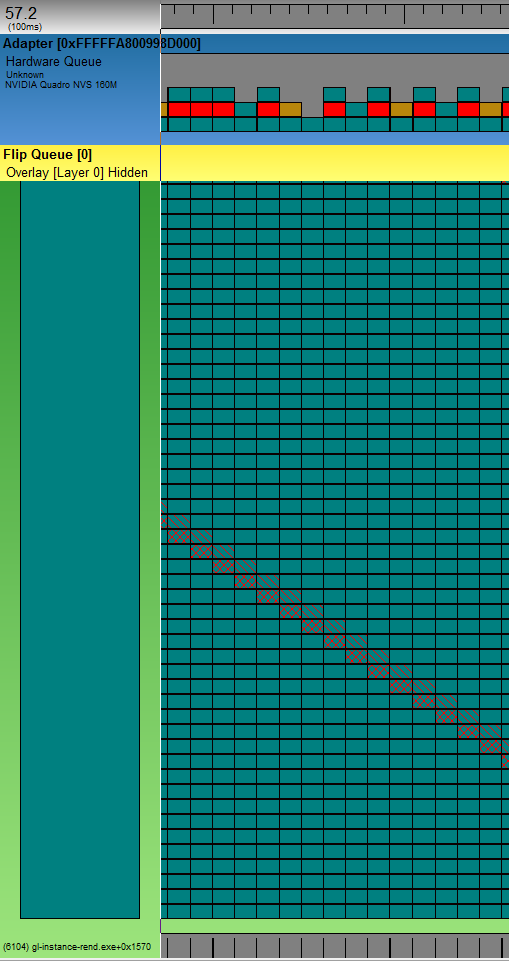
The light green lane is the test process having enormous rendering problems. The darker green parts are GPU command packets queued up in the process. The gray strip at the bottom is the CPU time consumed by the process. Since you see only thin black lines means the process is hardly consuming CPU time. But it heavily uses GPU. At the top you see a ruler. One tick of the ruler is about 100ms. The top blue lane is the graphics card and the hardware queue of command packets. The dark green packets are packets from the test process which are moved from software to hardware when there is room in the hardware queue. So it takes the GPU around 100ms to process one dark green packet!
The red packets are from the idle process and the brown from the dwm.exe process. Don't get confused by the size of the red and the brown packets. One needs to get used to the presentation type of GPUView. The packet in the pottom row of the hardware queue is the packet being processed. This packet determines the width of the whole (!) column. When it's the turn of the red and the brown packet to be processed, they are so fast, that you never see them in the bottom row. Here's a screen shot zoomed in onto one of those red packets:

The ruler ticks are now 1ms. Once it's turn for the red packet to be processed, it finishes in less than 1ms.
So we found out that the GPU is the bottleneck. The application hardly uses CPU but it creates heaps of GPU command packets and each packet takes ages (in terms of GPU time) to be processed. The question is why.
The next step in finding a problem is to reduce the complexity of the test. Reduce it as far as possible. Sometimes it's easier to restart from zero and add complexity until the problem occurs. This is what I did. I recreated the program step by step. First it drew small numbers of cubes with indexed drawing and instanced drawing. Then I added more and more cubes. GPUView confirmed that the number of command packets increased along with cube count. This was expected. But the execution time for each packet was around 0.8-3ms depending on the camera position (how many cubes were visible) but independent of the drawing style! Indexed drawing and instanced drawing were equally fast.
So my rewrite reached the complexity of the original program without triggering the problem. I started to replace parts of the original program with parts from my program. After I replaced the lattice calculation I noticed a strange cube right in the center of the grid. The grid in the original program was aligned in a way that the camera would face the center of a cube:

But in my rewrite I placed the camera between the rows and colums:

The strange cube was there in both versions. But in my rewrite it got visible. The performance dropped when the camera moved towards this cube.
I continued replacing parts of the program until the problem disappeared. And also the cube disappeared! I reverted my last change and realized that it was a bug in the code triggering the problem, not some strange OpenGL behaviour. This is the buggy line drawing the cubes:
Let's remember the vertex shader. For each instance it reads three float values from the
But why did it only perform so horribly when the camera moved towards the center cube? The vertices of the 16000 additional cubes did not make it so worse. I did some testing to come up with the solution for this. The program hits the graphic card memory speed limit. How's this? Here is what happens: Each fragment (pixel) painted by OpenGL has to be transferred to the graphic card memory. OpenGL prevents the most paints by not painting invisible parts. The depth buffer is very good at this task. But how about identical objects on exactly the same position? Is the front face of cube 8001 concealed by the front face of cube 8002 which is on the same position? It looks like OpengGL thinks it is not. So it paints all front faces of all 16000 cubes in the center. When the cube is far away this are not many pixels. But as the camera moves towards the center the front face of the cube covers more and more pixels. When the calculation time for one frame drops to 500ms the cube is roughly 250x250 pixels big. Let's do some math:
250 * 250 = 62,500 - amount of pixels to draw for one cube front face
62,500 * 16,000 = 1,000,000,000 - pixels to draw for all 16,000 cubes in the center
1,000,000,000 * 3 = 3,000,000,000 - 3 bytes are transferred for each pixel
3,000,000,000 * 2 = 6,000,000,000 - so many pixel per second (we have 2fps)
That's a lot. Let's see what my graphic cart is able to handle. I'm using a notebook with a Nvidia Quadro NVS 160M. Those are the specs:
First step to find a problem is to reproduce it. So I copied the example code, fixed small compiler issues, and created shaders which were referenced but missing in the question example code. They are simple so I guess the author used similar shaders.
Fragment shader for both drawing methods:
#version 330 core

in vec3 fragmentColor;
out vec3 color;

void main() {
  color = fragmentColor;
}
The vertex shader for basic indexed drawing:#version 330 core
layout(location = 0) in vec3 vertexPosition;
layout(location = 1) in vec3 vertexColor;
out vec3 fragmentColor;
uniform mat4 MVP;
void main(){
gl_Position = MVP * vec4((vertexPosition), 1);
fragmentColor = vertexColor;
}
The vertex shader for instanced drawing:#version 330 core
layout(location = 0) in vec3 vertexPosition;
layout(location = 1) in vec3 vertexColor;
layout(location = 2) in vec3 translation;
out vec3 fragmentColor;
uniform mat4 MVP;
void main(){
gl_Position = MVP * vec4((vertexPosition + translation), 1);
fragmentColor = vertexColor;
}
With those changes I was able to confirm the questions claim. The performance of the indexed drawing was fine. The performance of the instanced drawing method was horrible. It not only rendered extremely slowly it also stalled the whole computer. The cpu load was nearly at 0%. Since the program stalled the whole computer the bottleneck must have been either some kind of a system wide lock (either a software lock or hardware if form of a resource).Next step was to create a system event trace file. This would not only tell me what the analysed program is doing but also how it interacts with the system. Windows 7 onwards has a very powerful event tracing system. The tools to create and analyse event traces are wprUI (Windows Performance Recorder) and wpaUI (Windows Performance Analyser). Both are part of the Windows 8.1 SDK. Here is a very nice blog if one wants to get down to details of performance analysing: randomascii.wordpress.com.
I enabled "GPU activity" and "Video glitches" profiles in wpr, recorded a session of the slow running program and opened it with GPUView. Also part of the Windows 8.1 SDK. The GPUView project site of Matt Fisher describes nicely how to read GPUView output. Here is a screen shot from GPUView's output generated from the recorded event trace:
The light green lane is the test process having enormous rendering problems. The darker green parts are GPU command packets queued up in the process. The gray strip at the bottom is the CPU time consumed by the process. Since you see only thin black lines means the process is hardly consuming CPU time. But it heavily uses GPU. At the top you see a ruler. One tick of the ruler is about 100ms. The top blue lane is the graphics card and the hardware queue of command packets. The dark green packets are packets from the test process which are moved from software to hardware when there is room in the hardware queue. So it takes the GPU around 100ms to process one dark green packet!
The red packets are from the idle process and the brown from the dwm.exe process. Don't get confused by the size of the red and the brown packets. One needs to get used to the presentation type of GPUView. The packet in the pottom row of the hardware queue is the packet being processed. This packet determines the width of the whole (!) column. When it's the turn of the red and the brown packet to be processed, they are so fast, that you never see them in the bottom row. Here's a screen shot zoomed in onto one of those red packets:
The ruler ticks are now 1ms. Once it's turn for the red packet to be processed, it finishes in less than 1ms.
So we found out that the GPU is the bottleneck. The application hardly uses CPU but it creates heaps of GPU command packets and each packet takes ages (in terms of GPU time) to be processed. The question is why.
The next step in finding a problem is to reduce the complexity of the test. Reduce it as far as possible. Sometimes it's easier to restart from zero and add complexity until the problem occurs. This is what I did. I recreated the program step by step. First it drew small numbers of cubes with indexed drawing and instanced drawing. Then I added more and more cubes. GPUView confirmed that the number of command packets increased along with cube count. This was expected. But the execution time for each packet was around 0.8-3ms depending on the camera position (how many cubes were visible) but independent of the drawing style! Indexed drawing and instanced drawing were equally fast.
So my rewrite reached the complexity of the original program without triggering the problem. I started to replace parts of the original program with parts from my program. After I replaced the lattice calculation I noticed a strange cube right in the center of the grid. The grid in the original program was aligned in a way that the camera would face the center of a cube:
But in my rewrite I placed the camera between the rows and colums:
The strange cube was there in both versions. But in my rewrite it got visible. The performance dropped when the camera moved towards this cube.
I continued replacing parts of the program until the problem disappeared. And also the cube disappeared! I reverted my last change and realized that it was a bug in the code triggering the problem, not some strange OpenGL behaviour. This is the buggy line drawing the cubes:
glDrawElementsInstanced(GL_TRIANGLES, sqIndice.size(), GL_UNSIGNED_INT,
 (GLvoid*) (0), latticePoints.size());
This is the line from my rewrite:
glDrawElementsInstanced(GL_TRIANGLES, indices.size(), GL_UNSIGNED_INT,
 (GLvoid*)NULL, gridCoordinates.size()/3);
glDrawElementsInstanced expects the count of instances (cubes) to draw not the count of array elements. So instead of drawing 8000 cubes as it was meant to it drew 24000 cubes. But that's not the whole story. ;)Let's remember the vertex shader. For each instance it reads three float values from the
latticePoints array and stores them in the vec3 translation variable. Since OpenGL tried to draw far more instances than the latticePoints array was able to supply (latticePoints contained 24000 float elements, but OpenGL tried to access 24000*3=72000 elements). So this out of bounds situation would usually create a illegal memory access. Luckily there are facilities which prevent a shader from crashing. So instead of a crash the shader just received zero values. translation was set to (0,0,0) so no translation happened. This is explanation for the mysterious cube in the center. Or more exactly: the 16000 mysterious cubes in the center.But why did it only perform so horribly when the camera moved towards the center cube? The vertices of the 16000 additional cubes did not make it so worse. I did some testing to come up with the solution for this. The program hits the graphic card memory speed limit. How's this? Here is what happens: Each fragment (pixel) painted by OpenGL has to be transferred to the graphic card memory. OpenGL prevents the most paints by not painting invisible parts. The depth buffer is very good at this task. But how about identical objects on exactly the same position? Is the front face of cube 8001 concealed by the front face of cube 8002 which is on the same position? It looks like OpengGL thinks it is not. So it paints all front faces of all 16000 cubes in the center. When the cube is far away this are not many pixels. But as the camera moves towards the center the front face of the cube covers more and more pixels. When the calculation time for one frame drops to 500ms the cube is roughly 250x250 pixels big. Let's do some math:
250 * 250 = 62,500 - amount of pixels to draw for one cube front face
62,500 * 16,000 = 1,000,000,000 - pixels to draw for all 16,000 cubes in the center
1,000,000,000 * 3 = 3,000,000,000 - 3 bytes are transferred for each pixel
3,000,000,000 * 2 = 6,000,000,000 - so many pixel per second (we have 2fps)
That's a lot. Let's see what my graphic cart is able to handle. I'm using a notebook with a Nvidia Quadro NVS 160M. Those are the specs:
- Memory clock: 700 MHz
- Memory bus bandwidth: 64bit
- Memory type: GDDR2, GDDR3
So the NVS160M is able to move 5,6GBytes per second (I'm ignoring the memory type here for simplicity). According to the calculation above the program moves about 6GBytes per second. Don't nail me down to the numbers! Everything is approximately! But this little calculation points out that the memory speed is clearly on it's limit. I did other tests to verify this. I moved the 16000 cubes a little bit on the z axis so the fist one would conceal the others. The frame processing time dropped drastically (16ms per frame)! Then I disabled the depth buffer which kept OpenGL from drawing unnecessary pixels. There it was again the horrible performance. Then I created another small program which would just paint two triangles to form a square and let OpenGL paint it thousand times. It surely took long. For a full screen windows of a size of 800x600 the GPU required 400ms per frame. Nearly no geometry. Only 6000 vertices!
So here's the culprit: graphic card memory speed. Or: the bug. Depends on the perspective. ;)
For the vigilant reader of the original stackoverflow.com question: the enabled multisampling surely took it's tall also.
Keine Kommentare:
Kommentar veröffentlichen