Montag, 27. Januar 2014

Is the Double-Check Idiom really *really* fixed?

The double-check idiom is a way to reduce lock contention for a lazy initialized thread safe class. Unfortunately it used not to work. Luckily it was fixed. But under which conditions is it to be considered fixed?

Preface: There is a magnificent article covering this topic: Double Check Locking by Bill Pugh et al.. This article tries to rephrase the facts from the linked resource in a simpler way. Anyone interessted in the deep core details should read the article by Bill Pugh et al.

When Java 1.4 was the most recent release the so called Double-Check Idiom was considered broken. Due to the Java memory model specifications it was not guaranteed to work as one would expect. This is the double-check idiom in it's pure form:
piblic class Boss {
  private String name;
  
  public Boss() {
    this.name = "";
  }
}

public class Company {
  private Boss boss = null;
  
  public Boss getBoss() {
    if (boss == null) {
      synchronized (this) {
        if (boss == null) {
          boss = new Boss();
        }
      }
    }
    return boss;
  }
}
There are two major reasons why this could fail: 1. operation reordering; 2. memory caches.

Operation Order:
The Java memory model guarantees that all memory operations will be finished before the synchronized block is left. But it doesn't say anything about the order of the memory operations inside the synchonized block. A compiler might change the order of memory operations. If the constructor of Boss is inlined, the assignment of boss field (pointing to memory holding boss instance) could be executed before the instance fields of the Boss class are assigned by the constructor code. This means a concurrent thread could see boss!=null while the initialization is still not finished.

Memory Caches:
Each thread may have it's own local cache of the main memory. So even if the initializing thread did finish all memory write operations, a concurrent thread might see the new value of the Company.boss field but the old (uninitialized) memory values for the Boss class fields. This is what the Java Language Specification (Java 1.7) says about memory effects of the synchronized block:

JLS 17.4.4. Synchronization Order
... An unlock action on monitor m synchronizes-with all subsequent lock actions on m (where "subsequent" is defined according to the synchronization order). ...

So it guarantees that everything what thread A did before it left the synchronized block will be visible to thread B when it enters a synchronized block which locks on the same mutex. Note that it doesn't state anything about what is visible to threads which do not enter a synchronized block! So the changes from the double-checked idiom might be visible, might be partially visible or might be not visible to other threads.

Changes to the Java Memory Model in 1.5

Java 1.5 implements a more recent memory model specification. The modification which is interesting in this context is the change to access to volatile variables. The read or write of a volatile variable is not allowed to be reordered with respect to any previous or following read or writes. This means the compiler is not allowed to reorder the write of Company.boss field if it is declared volatile.

The fixed example from above would look like this:
public class Company {
  private volatile Boss boss = null;
  
  ....
}
Concluding: the double-checked idiom was really really broken before Java 1.5. It is really really fixed with Java >= 1.5 only when the the field being checked in the double-checked idom is declared volatile. If it is not, it's still broken.
Dienstag, 21. Januar 2014

Java polymorphism and equals()

Let's start by having a small introduction. The mother of all Java classes - Object - does define a equals() method, which is meant to return true if the passed instance is equal to the current instance. The default implementation is limited to comparing references. So it will only return true when the current and the passed object are the same. The equals() method is meant to be overridden by extending classes with meaningful logic. The implementation has to obey some requirements (from javadoc on Object.equals()):
The equals() method guarantees that...

  • It is reflexive: for any non-null reference value x, x.equals(x) should return true.
  • It is symmetric: for any non-null reference values x and y, x.equals(y) should return true if and only if y.equals(x) returns true.
  • It is transitive: for any non-null reference values x, y, and z, if x.equals(y) returns true and y.equals(z) returns true, then x.equals(z) should return true.
  • It is consistent: for any non-null reference values x and y, multiple invocations of x.equals(y) consistently return true or consistently return false, provided no information used in equals comparisons on the objects is modified.
  • For any non-null reference value x, x.equals(null) should return false.

Quite a bunch. Luckily those requirements are often easy to achieve. Let's create a simple class and equip it with a equals method.

A Drink

public class Drink {
  private final int size;

  public Drink(final int size) {
    this.size = size;
  }

  @Override
  public boolean equals(final Object obj) {
    if (!(obj instanceof Drink)) return false;
    return equals((Drink) obj);
  }

  public boolean equals(final Drink other) {
    return this.size == other.size;
  }
}
This equals() implementation obeys all the requirements above. And I added a convenience method with the exact type. Note that equals(Drink) does overload Object.equals(Object) but it does not override it! The difference between those two will be important later.

A Drink? A Coffee? A Coke?

Now let's introduce polymorphism. We add two classes Coffee and Coke which extend the Drink class:
public class Coffee extends Drink {
  private final int coffeine;

  public Coffee(final int size, final int coffeine) {
    super(size);
    this.coffeine = coffeine;
  }

  @Override
  public boolean equals(final Object obj) {
    if (!(obj instanceof Coffee)) return false;
    return equals((Coffee) obj);
  }

  public boolean equals(final Coffee other) {
    if (!super.equals(other)) return false;
    return coffeine == other.coffeine;
  }
}

public class Coke extends Drink {
  private final int sugar;

  public Coke(final int size, final int sugar) {
    super(size);
    this.sugar = sugar;
  }

  @Override
  public boolean equals(final Object obj) {
    if (!(obj instanceof Coke)) return false;
    return equals((Coke) obj);
  }

  public boolean equals(final Coke other) {
    if (!super.equals(other)) return false;
    return sugar == other.sugar;
  }
}
The equals() methods are implemented here in a similar way. Everything looks fine, doesn't it? Let's see how the equals() methods behave:
final Drink drink = new Drink(15);
final Drink secondDrink = new Drink(15);

System.out.println("drink.equals(secondDrink): " + drink.equals(secondDrink));
System.out.println("secondDrink.equals(drink): " + secondDrink.equals(drink));

final Coffee coffee = new Coffee(15, 3);
final Coke coke = new Coke(15, 42);

System.out.println("coffee.equals(drink): " + coffee.equals(drink);
System.out.println("drink.equals(coffee): " + drink.equals(coffee));
System.out.println("coke.equals(coffee): " + coke.equals(coffee));
What’s the output? Your brain might tell you something like this:
drink.equals(secondDrink): true
secondDrink.equals(drink): true
coffee.equals(drink): false
drink.equals(coffee): false
coke.equals(coffee): false
But what’s the actual output? This:
drink.equals(secondDrink): true
secondDrink.equals(drink): true
coffee.equals(drink): true
drink.equals(coffee): true
coke.equals(coffee): true
Wow! What's happening? drink.equals(coffee) is passed a parameter of type Coffee. The best method match for this type is Drink.equals(Drink). This method does only compare the size field. Since it's equal it returns true. coffee.equals(drink) is passed a parameter of type Drink. The best method match for this type is.... Drink.equals(Drink)! Not Coffee.equals(Object)! So again only the size field is compared. The same goes for coke.equals(coffee): Drink.equals(Drink) is invoked.
First lesson: it’s a bad idea to implement convenience public equals() methods with different types than Object. Or in other words: do not overload equals(), override it.

Now let’s “fix” this problem by making the overloaded methods private. What will be the output this time? This:
drink.equals(secondDrink): true
secondDrink.equals(drink): true
coffee.equals(drink): false
drink.equals(coffee): true
coffee.equals(coke): false
Still not quite the output we're expecting. What’s happening now? When coffee.equals(drink) is invoked, the Coffee.equals(Object) method is executed, Drink instance is checked against “instanceof Coffee” and this evaluates to false. But when we invoke drink.equals(coffee) the equals() implementation in Drink is executed and the passed instance is checked against “instanceof Drink”. Since Coffee is a extension of Drink, this evaluates to true.

Not all Drinks are Coffees

So is polymorphism broken in Java? Not quite. It seems like instanceof is not the check you should use per default in equals(). It's sometimes important, we'll see in a minute, but usually what you'd like to do is to use Object.getClass() and compare the class of the passed instance to the class of the current instance:
public class Drink {
  ...

  @Override
  public boolean equals(final Object obj) {
    if (obj == null) return false;
    if (this.getClass() != obj.getClass()) return false;
    return equals((Drink) obj);
  }

  private boolean equals(final Drink other) {
    return this.size == other.size;
  }
}

// changes in Coffee and Coke similar
As specified by documentation of getClass(), it is guaranteed to return the same Class instance for the same class. So it is save to use the == operator. Note that obj.getClass() is compared against this.getClass() and not against Drink.class! If we'd compare against the hard coded class super.equals() invocations from extending classes would always fail for non Drink instances.

Second lesson: use Object.getClass() in equals() if unsure. Only use instanceof if you know what you do. ;)

Instanceof

Now when would one want to use instanceof in equals() implementations? The semantics of equals() implementations are actually up to you (as long you follow the restrictions stated at the beginning). In my example above I wanted to have Drink!=Coffee!=Coke. But that's just a definition thing. Sometimes you want to have a set of types behave like one type. The Java class library does this for lists and maps for example. A TreeMap and a HashMap are considered equal if they contain the same objects. Even though a TreeMap has an element order which a HashMap does not have. The types achieve this by having a AbstractMap class implement a equals() method which checks against "instanceof Map" and checks only Map properties. All extensions of AbstractMap do not override (and do not overload) equals().

One more thing

Don't forget to implement hashCode() if you override equals(). Both methods have a tight relationship. Whenever a.equals(b) returns true, also a.hashCode() has to be equal to b.hashCode()!

Diagnose OpenGL Performance Problems

I stumbled upon an interesting OpenGL slow down issue on stackoverflow.com: Curious slowdown in opengl when using instanced rendering. The author created a program which would render 20 x 20 x 20 cubes in two different ways: indexed drawing and instanced drawing. When using indexed drawing performance seemed fine. But after switching to instanced drawing it broke down. But only in a special case. As described by the question author: when the camera position changed the performance changed from decent (distance at 40) to horrible (distance at 0). This sounded strange.

First step to find a problem is to reproduce it. So I copied the example code, fixed small compiler issues, and created shaders which were referenced but missing in the question example code. They are simple so I guess the author used similar shaders.

Fragment shader for both drawing methods:
#version 330 core

in vec3 fragmentColor;
out vec3 color;

void main() {
  color = fragmentColor;
}
The vertex shader for basic indexed drawing:
#version 330 core

layout(location = 0) in vec3 vertexPosition;
layout(location = 1) in vec3 vertexColor;

out vec3 fragmentColor;
uniform mat4 MVP;

void main(){
  gl_Position = MVP * vec4((vertexPosition), 1);
  fragmentColor = vertexColor;
}
The vertex shader for instanced drawing:
#version 330 core

layout(location = 0) in vec3 vertexPosition;
layout(location = 1) in vec3 vertexColor;
layout(location = 2) in vec3 translation;

out vec3 fragmentColor;

uniform mat4 MVP;

void main(){
  gl_Position = MVP * vec4((vertexPosition + translation), 1);
  fragmentColor = vertexColor;
}
With those changes I was able to confirm the questions claim. The performance of the indexed drawing was fine. The performance of the instanced drawing method was horrible. It not only rendered extremely slowly it also stalled the whole computer. The cpu load was nearly at 0%. Since the program stalled the whole computer the bottleneck must have been either some kind of a system wide lock (either a software lock or hardware if form of a resource).

Next step was to create a system event trace file. This would not only tell me what the analysed program is doing but also how it interacts with the system. Windows 7 onwards has a very powerful event tracing system. The tools to create and analyse event traces are wprUI (Windows Performance Recorder) and wpaUI (Windows Performance Analyser). Both are part of the Windows 8.1 SDK. Here is a very nice blog if one wants to get down to details of performance analysing: randomascii.wordpress.com.

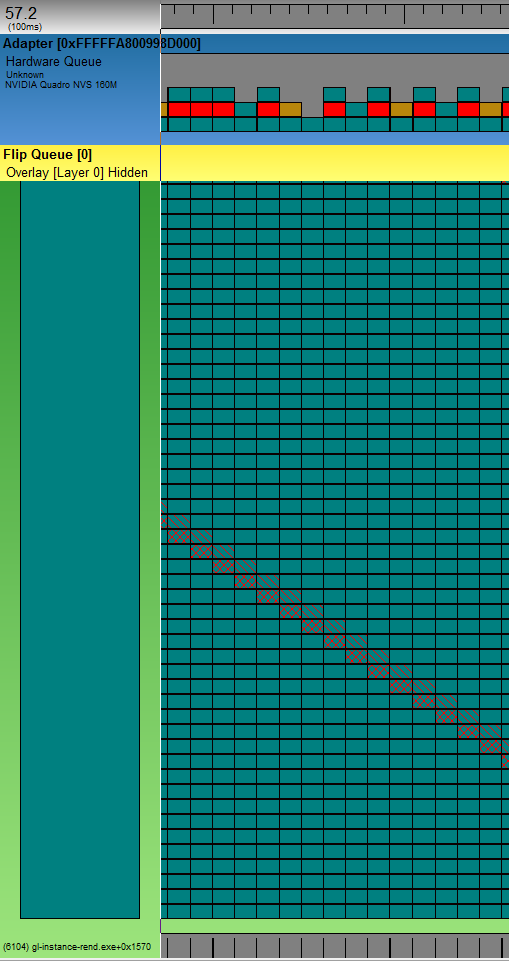
I enabled "GPU activity" and "Video glitches" profiles in wpr, recorded a session of the slow running program and opened it with GPUView. Also part of the Windows 8.1 SDK. The GPUView project site of Matt Fisher describes nicely how to read GPUView output. Here is a screen shot from GPUView's output generated from the recorded event trace:


The light green lane is the test process having enormous rendering problems. The darker green parts are GPU command packets queued up in the process. The gray strip at the bottom is the CPU time consumed by the process. Since you see only thin black lines means the process is hardly consuming CPU time. But it heavily uses GPU. At the top you see a ruler. One tick of the ruler is about 100ms. The top blue lane is the graphics card and the hardware queue of command packets. The dark green packets are packets from the test process which are moved from software to hardware when there is room in the hardware queue. So it takes the GPU around 100ms to process one dark green packet!
The red packets are from the idle process and the brown from the dwm.exe process. Don't get confused by the size of the red and the brown packets. One needs to get used to the presentation type of GPUView. The packet in the pottom row of the hardware queue is the packet being processed. This packet determines the width of the whole (!) column. When it's the turn of the red and the brown packet to be processed, they are so fast, that you never see them in the bottom row. Here's a screen shot zoomed in onto one of those red packets:


The ruler ticks are now 1ms. Once it's turn for the red packet to be processed, it finishes in less than 1ms.

So we found out that the GPU is the bottleneck. The application hardly uses CPU but it creates heaps of GPU command packets and each packet takes ages (in terms of GPU time) to be processed. The question is why.

The next step in finding a problem is to reduce the complexity of the test. Reduce it as far as possible. Sometimes it's easier to restart from zero and add complexity until the problem occurs. This is what I did. I recreated the program step by step. First it drew small numbers of cubes with indexed drawing and instanced drawing. Then I added more and more cubes. GPUView confirmed that the number of command packets increased along with cube count. This was expected. But the execution time for each packet was around 0.8-3ms depending on the camera position (how many cubes were visible) but independent of the drawing style! Indexed drawing and instanced drawing were equally fast.

So my rewrite reached the complexity of the original program without triggering the problem. I started to replace parts of the original program with parts from my program. After I replaced the lattice calculation I noticed a strange cube right in the center of the grid. The grid in the original program was aligned in a way that the camera would face the center of a cube:

But in my rewrite I placed the camera between the rows and colums:


The strange cube was there in both versions. But in my rewrite it got visible. The performance dropped when the camera moved towards this cube.

I continued replacing parts of the program until the problem disappeared. And also the cube disappeared! I reverted my last change and realized that it was a bug in the code triggering the problem, not some strange OpenGL behaviour. This is the buggy line drawing the cubes:
glDrawElementsInstanced(GL_TRIANGLES, sqIndice.size(), GL_UNSIGNED_INT,
 (GLvoid*) (0), latticePoints.size());
This is the line from my rewrite:
glDrawElementsInstanced(GL_TRIANGLES, indices.size(), GL_UNSIGNED_INT,
 (GLvoid*)NULL, gridCoordinates.size()/3);
glDrawElementsInstanced expects the count of instances (cubes) to draw not the count of array elements. So instead of drawing 8000 cubes as it was meant to it drew 24000 cubes. But that's not the whole story. ;)

Let's remember the vertex shader. For each instance it reads three float values from the latticePoints array and stores them in the vec3 translation variable. Since OpenGL tried to draw far more instances than the latticePoints array was able to supply (latticePoints contained 24000 float elements, but OpenGL tried to access 24000*3=72000 elements). So this out of bounds situation would usually create a illegal memory access. Luckily there are facilities which prevent a shader from crashing. So instead of a crash the shader just received zero values. translation was set to (0,0,0) so no translation happened. This is explanation for the mysterious cube in the center. Or more exactly: the 16000 mysterious cubes in the center.

But why did it only perform so horribly when the camera moved towards the center cube? The vertices of the 16000 additional cubes did not make it so worse. I did some testing to come up with the solution for this. The program hits the graphic card memory speed limit. How's this? Here is what happens: Each fragment (pixel) painted by OpenGL has to be transferred to the graphic card memory. OpenGL prevents the most paints by not painting invisible parts. The depth buffer is very good at this task. But how about identical objects on exactly the same position? Is the front face of cube 8001 concealed by the front face of cube 8002 which is on the same position? It looks like OpengGL thinks it is not. So it paints all front faces of all 16000 cubes in the center. When the cube is far away this are not many pixels. But as the camera moves towards the center the front face of the cube covers more and more pixels. When the calculation time for one frame drops to 500ms the cube is roughly 250x250 pixels big. Let's do some math:

250 * 250 = 62,500 - amount of pixels to draw for one cube front face
62,500 * 16,000 = 1,000,000,000 - pixels to draw for all 16,000 cubes in the center
1,000,000,000 * 3 = 3,000,000,000 - 3 bytes are transferred for each pixel
3,000,000,000 * 2 = 6,000,000,000 - so many pixel per second (we have 2fps)

That's a lot. Let's see what my graphic cart is able to handle. I'm using a notebook with a Nvidia Quadro NVS 160M. Those are the specs:
  • Memory clock: 700 MHz
  • Memory bus bandwidth: 64bit
  • Memory type: GDDR2, GDDR3
 
700,000,000 * 8 = 5,600,000,000 - That's the clock multiplied by the bus bandwidth

So the NVS160M is able to move 5,6GBytes per second (I'm ignoring the memory type here for simplicity). According to the calculation above the program moves about 6GBytes per second. Don't nail me down to the numbers! Everything is approximately! But this little calculation points out that the memory speed is clearly on it's limit. I did other tests to verify this. I moved the 16000 cubes a little bit on the z axis so the fist one would conceal the others. The frame processing time dropped drastically (16ms per frame)! Then I disabled the depth buffer which kept OpenGL from drawing unnecessary pixels. There it was again the horrible performance. Then I created another small program which would just paint two triangles to form a square and let OpenGL paint it thousand times. It surely took long. For a full screen windows of a size of 800x600 the GPU required 400ms per frame. Nearly no geometry. Only 6000 vertices!

So here's the culprit: graphic card memory speed. Or: the bug. Depends on the perspective. ;)

For the vigilant reader of the original stackoverflow.com question: the enabled multisampling surely took it's tall also.


Donnerstag, 16. Januar 2014

Extract one folder from a Subversion repository into a GIT repository including complete history

This task is so common that there are a lot of articles and howtos on the net. This is mere a collection of information snippets and links to further reading. This article focuses on extracting a specific folder from a Subversion repository. This requirement seems to be untypical. All references I found assume the Subversion repository contains only one projects (including its branches and tags). But if in your case you placed all your projects in one Subversion repository, this article will tell you how you detach one.

Subversion to GIT conversion is done by the git svn command and it's sub commands. Pass the repository folder to git svn clone, and the command will clone the complete repository and complete history from revision 1. If you pass the full path to your project to the command (it doesn't matter if you pass the path as part of the repository path 'git svn clone http://svnserver/repo/trunk/myproject' or as trunk parameter 'git svn clone http://svnserver/repo -T trunk/myproject') it will clone the history from the revision on when your project folder was created. It doesn't care if your project contains files which are older than the project folder. For example: you restructured your project; once you had three modules:

  • "module1"
  • "module2"
  • "module3"

Then you created a new project folder "new project" and moved the modules into this folder:

  • "new project/module1"
  • "new project/module2"
  • "new project/module3"

Using the command above will ignore the history of the modules which is older than the "new project" folder. Even using --follow-parent will not get you the history, since "new project" has no parent, it was newly created. Sad.

Now let's check out how we get the complete history. I found two ways:

  • remove everything uninteresting from Subversion repository, and purge it from history
  • clone completely to GIT and remove/purge the uninteresting parts in GIT
To accomplish the first approach you'd need to use svnadmin dump (since there is no way to delete revisions from Subversion) to rebuild a repository while filtering the uninteresting files. I choose to use the second approach. And here's how you do it.

Clone Subversion Repository
From Git and Other Systems - Migrating to Git:
git svn clone http://svnserver/repo/ --authors-file=users.txt --no-metadata my_project
If anything goes wrong during cloning (for example your network connection dies, or you see a "unknown user" message) fix the problem and continue the process by invoking
git svn fetch
Remove Uninteresting Parts from GIT Repository
After successfully cloning the svn repository, we'd like to shrink down the repository to the project we'd like to keep. Before we do this, we need to convert the repository to a bare git repository. Bare git repositories are the only ones which are allowed to be pushed to. From my_project/.git move everything one level higher, so .git subdirectory ends up empty. Delete the empty .git directory. Now edit my_project/config and change "bare" setting to "true". After completing this you'll have a bare repository and we can continue to filter it.
From git: shrinking Subversion import:
git filter-branch -d /dev/shm/scratch --index-filter \
  "git rm -r --cached -f --ignore-unmatch 'Old Project'; \
   git rm -r --cached -f --ignore-unmatch 'Some Temp Stuff'; \
   git rm -r --cached -f --ignore-unmatch 'One More Project'" \
  --prune-empty --tag-name-filter cat -- --all
(choose a different temp folder for the -d parameter when not running on a up to date Linux)
git rm expects top level names. So the command above will remove the folders "/Old Project/", "/Some Temp Stuff/", "/One More Porject/" and everything that's below. You can specify folders on a deeper level like this:
git rm -r --cached -f --ignore-unmatch 'trunk/Delete-This-Project'
This syntax to git rm does no substring matching (folder names have to be complete). After this run the GIT repository will only contain the project you're interested in, including the whole history (assuming the history of your project does not intersect with folders you deleted).

Reduce Size of GIT Repository
GIT tries really hard not to delete stuff you might still need. So filter-branch will not reduce the size of your repository on disk. To remove all the deleted bits and bytes you also have to (copied from Detach subdirectory into separate Git repository):
git for-each-ref --format="%(refname)" refs/original/ | xargs -n 1 git update-ref -d
git reflog expire --expire=now --all
git gc --aggressive --prune=now

That's it. If everything went fine your GIT repository will contain only the stuff you're interested in.