Donnerstag, 5. März 2015

My IntelliJ IDEA 'wow' Moments

I've been using Eclipse for years. It's been my IDE #1. But lately it got slow. Very slow. Especially when switching branches and Eclipse tried to catch up with the changes. At some point it annoyed me so much, that I decided to give IntelliJ IDEA a try. I had several team mates using IDEA and being totally excited about it
Well, I switched, and I didn't regret this. While there are a lot of good features (like type suggestions which very often suggest exactly what you need, or search by typing everywhere in the UI), here are some features which really made me 'wow'.

Intentions


Intentions is a way to quickly modify code. ALT-ENTER is you shortcut to access intentions. Depending on the context IntelliJ will suggest you to do different things. F.e.: invert a if-clause condition, create JavaDoc, initialize a field by adding a constructor parameter. You can quickly create a lot of boilerplate code by pressing ALT-ENTER and ALT-INSERT (create code) in turn.

Structural Search


Ever wanted to find a interface which complies to a specific structure? Well, I did. Back in my Eclipse times I wondered if there is a public interface which has exactly one void method expecting exactly one generic parameter. The idea was to implement a call back which will receive one value. Sure, I could have written the interface myself, but this requirement appeared so common to me, that I suspected, that there is some public interface already doing exactly this. Well, with features provided by Eclipse I was stuck.

Until I switched to IntelliJ and discovered Structural Search (CTRL-SHIFT-S). It allows you to search for, well...., structures. You specify something like a multi line template, and let IntelliJ search for everything which matches this template. For my specific needs, the template looked like:

interface $Class$ {   void $MethodName$($ParameterType$ $Parameter$); }

Each parameter is configurable by constraints like pattern, min count, max count, if it's read from or written to, etc.... For my purpose I set $MethodName$ name and $Parameter$ to be exactly one. This led to too many interfaces having this exact structure I was looking for, but they didn't match quite well. Eventually I discovered one interface which looked exactly like what I was looking for. The method was named 'execute'. So I modified it in the search and I also changed the type to a common generic type name to see how many of this kind are there:

interface $Class$ {   void execute(T $Parameter$); }

This yielded exactly one match. Sadly a inner class, but luckily a public static one. So I just used it.

public class ActionCell<C> extends AbstractCell<C> {  public static interface Delegate<T> {  void execute(T object);  }    ... }

Inspections


Inspections is the IntelliJ way of static code analysis. The fact that there is static code analysis itself is probably not so 'wow', after all there are a lot of tools out there providing exactly this. But since it's integrated into the IDE in the tightest way I experienced until now, it gives you an awesome coding experience. What it makes even more 'wow' is that nearly each inspection has an associated quick fix. Press ALT-Enter and let IntelliJ convert the code for you. Additionally IntelliJ features inspection rules I haven't seen in other products yet. For example it will offer you to generalize List parameters to Collection or even Iterable if you don't use features of the sub interfaces. IntelliJ features 632 inspections for several languages: Java, HTML, CSS, JS, XML.

Mighty Break Points


I love this! I know conditional break points already from Eclipse. But check this out:
  • Chose whether you want to suspend all threads if a break point is hit, or only the thread which hit the break point.
  • Log a message to a console when a break point is hit
  • Log a evaluated expression to console when a break point is hit
  • Limit break point triggering to only one single instance of a class (you can chose the instance at run time)
  • Limit break point triggering to only one class implementation of the base class.
  • Automatically disable the break point once it was hit.
  • Automatically re-enable the break point after another break point was hit.
  • Create 'method break' points. This allows you to create break points based on class name and method name patterns. They will be triggered on entry and on exit of the method. This way you can super easy track (log lines) enter and exit of methods.
  • Create breakpoints which will trigger if a field is accessed or modified (for fairness: Eclipse also supports field break points).

Live Templates

Live Templates are a way to generate code in IntelliJ. The trick is: it allows variables, which will be filled depending on the context. Live Template suggestions will appear whenever you type the configured abbreviation, or when you press CTRL-J. Type 'psf' in class context, and the 'public static final' template will be suggested. Live Templates are context aware. You won't get this suggestion if you're in a method body. Type "iter" and hit enter. IntelliJ will create a for-each block and automatically pick an iterable variable from the current context and prefill the for declaration. Additionally it will correctly choose the item type and create a meaningful item name. The cursor will be placed on the iteratable variable. If you don't like the automatic selection, type what you want to have iterated. IntelliJ will automatically update the item type and the item name. Fancy, eh? Next example: I had problems when writing JavaDoc because in IntelliJ you have to type {@link until the IDE starts suggesting classes (in Eclipse you directly start typing the class name). So I fixed this myself using Live Templates:
{@link $LINK$}
The variable $LINK is configured to be the result of the complete() function, which will open the type suggestion box. Whenever I type @link and hit enter, IntelliJ will complete the expression and offer a type selection for me. Next: Creating a Logger declaration:
private static final java.util.logging.Logger LOG = java.util.logging.Logger.getLogger($CURRENT_CLASS$.class.getName());
$CURRENT_CLASS$ is configured to be className(), which returns the current class name. Packages will be automatically converted to imports if possible, which creates this nice code (for class MyClass):
private static final Logger LOG = Logger.getLogger(MyClass.class.getName());

Analyze Stacktrace


You received a stack trace and want to examine the code places in the project. Stop! Don't look up the classes manually. Hit CTRL-SHIFT-A ('Enter action') and type "stacktrace". This will suggest you: "Analyze Stacktrace...". Paste the stack trace there. A tool window opens containing the stack trace with links which directly jump into code. Great time saver!

Montag, 24. März 2014

Do we need to synchronize everything?

Evaluation of ThreadSafe made me think about the Java Memory Model and it's implications on threaded programs. In tech jibberish the Java Language Specifications states that a thread is only guaranteed to see memory values modified by other threads if it synchronizes to them. It is not enough if only the writing thread uses a synchronize statement. Each thread which needs to see up to date values, needs to synchronize (enter the synchronized statement). Even more restrictive: thread T1 is only guaranteed to see all changes T2 did, before releasing monitor L, when it also acquires monitor L before reading the values (in JLS language: "An unlock action on monitor m synchronizes-with all subsequent lock actions on m (where 'subsequent' is defined according to the synchronization order)", chapter 17.4.4 Java Language Specification).

Example: (globalInt == 0 at the beginning)
T1T2
globalInt = 3;
int x = globalInt; // may be 0 or 3

The Java Memory Model does not define what T2 is going to see. Now with synchronization but different monitors:

T1T2
synchronized (L1) {
  globalInt = 3;
}
int x;
synchronized (L2) {
  x = globalInt; // may be 0 or 3
}

Even though it uses synchronization and even if T2 runs after T1 finished, T2 is not guaranteed to see the new value. The Java Memory Model guarantees this only for this case, synchronizing to the same monitor (volatile and final are also possible, they will be discussed later):

T1T2
synchronized (L1) {
  globalInt = 3;
}
int x;
synchronized (L1) {
  x = globalInt; // will see 3, if executed after T1
}

If that's true, what does this mean to a real case scenario like "initialize once, use multiple times":

private static volatile Map<String> map;
 
public Map<String> getMap() {
 if (map == null) {
  synchronized (this) {
   if (map == null) {
    Map<String> newMap = new HashMap<>();
    fillMap(newMap);
    map = newMap;
   }
  }
 }
 return map;
}


This is a map lazily initialized by a classic double-checked idiom. It is correctly implemented as of Java 1.5. This example uses a HashMap instead of a ConcurrentMap for optimization purposes. Since the map is used read-only after initialization, this is save. volatile makes sure other threads are going to see the new reference written to the variable map. But what happens to the elements of the map? The map reference is volatile, but the map elements are not. You learned previously that two threads need to synchronize to the same monitor if they want to make sure to see the same values. But in this case some readers may never reach the synchronize statement if the initialization was finished already. So what are the readers guaranteed to see?

Java Memory Model - Enlightened


Volatile

The promise the Java Memory Model makes for locks also goes for volatile reads and writes. It defines, that all writes to a volatile variable synchronize-with all reads of the same variable (JLS 17.4.4). This means, once the reader threads read the variable map, they are guaranteed to see all changes the writer thread did before writing to map. This means, assigning the new HashMap instance to a local variable (newMap) first and then assigning it to the field (only after it is fully initialized), is crucial for two reasons:
  1. Assigning map before fillMap() would reveal the reference to the newly created map to other threads before initialization is finished. This means other threads could see inconsistent data. Additionally this might lead to serious problems when get() and put() are executed concurrently (HashMap is not thread safe).
  2. The Java Memory Model guarantees visibility only for writes which happened before the write to a volatile field. This means all writes after assignment of map are not guaranteed to be visible to other threads.

Non-Volatile

There is another way to make it work according to the Java Memory Model if the object doesn't has to be created lazily. The Java Language Specification says: "An object is considered to be completely initialized when its constructor finishes. A thread that can only see a reference to an object after that object has been completely initialized is guaranteed to see the correctly initialized values for that object's final fields." (JLS 17.5). So can you rewrite the example above in this way?:

private static final Map<String> map = new HashMap<>();
 
public Map<String> getMap() {
 if (map.size() == 0) {
  synchronized (this) {
   if (map.size() == 0) {
    fillMap(map);
   }
  }
 }
 return map;
}

No, you cannot rewrite it like this. Apart from the obvious problem that, the map could be modified while it is being read (once one element was added), there are no data visibility guarantees according to the Java Memory Model regarding the map elements. Since the map field is not volatile any more, there is no synchronizes-with relationship between threads any more. But this will work:


private static final Map<String> map = new HashMap<>();
private static volatile initialized = false;

public Map<String> getMap() {
 if (!initialized) {
  synchronized (this) {
   if (!initialized) {
    fillMap(map);
    initialized = true;
   }
  }
 }
 return map;
}

Now reading of initialized synchronizes-with the write of initialized variable and thus all other writes happened until that moment. But then we're back at using volatile fields. The following approach works the best, when you can go completely without lazy initialization:


private static final Map<String> map = createAndFillMap();

public Map<String> getMap() {
 return map;
}

The next sample will work also AND is lazy initialized, but it tries to be smart and thus should not be your first choice (Don't Be Too Smart).


public Map<String> getMap() {
 return MapHolder.map;
}
 
private static class MapHolder {
 private static final Map<String> map = createAndFillMap();
}

This implementation relies on the Java Language Specification guarantee, that classes are loaded when they are used for the first time (JLS 5.3).


But we're still not done talking about finals. If you read the Java Language Specification guarantee for final fields carefully you noticed this part: "... after that object has been completely initialized is guaranteed to see the correctly initialized values for that object's final fields.". Completely initialized is defined by finishing the constructor. Thus if the constructor leaks the reference to the object being constructed, there are no guarantees about thread visibility of the final field.


public class Counter {
 private final AtomicInteger counter;
 
 public Counter(int startValue) {
  counter = new AtomicInteger(startValue);
  CounterRegistry.register(this);
 }
}

The constructor above leaks the reference before the constructor is finished. If a foreign thread picks up the reference (before the constructor finished) it may or may not see correct values. In general: avoid leaking this from constructors.

ReadWriteLock Implementation

Just out of curiosity: how is ReadWriteLock implemented? After all this lock features distinct handling of write-locking and read-locking. If these are separate locks, how does this comply to the Java Memory Model, which states that the same monitor has to be used?

The ReentrantReadWriteLock implementation of ReadWriteLock uses two local fields readerLock and writerLock which internally use the same Sync object. Sync is a implementation of AbstractQueuedSynchronizer. And AbstractQueuedSynchronizer in turn uses a internal volatile field. So it boils down to: ReentrantReadWriteLock is implemented - in perfect harmony with the Java Memory Model - using one volatile int field (using LockSupport.park() to wait if acquiring write lock doesn't succeed immediately).

Compiler Optimizations Allowed By the Java Memory Model

The Java Memory Model preserves great freedom for optimizations of compilers. The whole JMM guarantees build around "happens-before", "synchronizes-with" relationships and "well-formed execution" rules. The definitions go like "a read has to see the effects of a write, if that write came before the read in program order, and there was no other write in between". It doesn't say that the write actually has to happen when the write command is encountered in program order. It only states that the read has to see the effects. So it's completely valid for the compiler to move the write just immediately before the reading line. Or: let the write happen only to processor registers and write it back to memory much later when the compiler thinks is's appropriate. Or even: remove the write completely if there is no read which needs to see the write effects.

If you take a look at this simple code snippet:
x = 0;
y = 1;

It wouldn't surprise anyone if the compiler would reorder the two statements. There is probably no optimization benefit, but there is also no obvious reason why the compiler shouldn't. But take this code:

// double-checked idiom wrongly implemented
private Object instance;
Object getInstance() {
  if (instance == null) {
    synchronized(this) {
       if (instance == null) {
          Object helper;
          synchronized (this) {
             helper = new Object();
          }
          instance = helper;
       }
    }
  }
  return instance;
}

(the code is discussed in Bidirectional Memory Barrier as a attempt to implement the double-checked idiom without volatile keyword) The Java Memory Model does not prevent the compiler to change the code to:

private Object instance;
Object getInstance() {
  if (instance == null) {
    synchronized(this) {
       if (instance == null) {
          synchronized (this) {
           Object helper;
           helper = new Object();
           instance = helper;
          }
       }
    }
  }
  return instance;
}


And then in the next step:

private Object instance;
Object getInstance() {
  if (instance == null) {
    synchronized(this) {
       if (instance == null) {
          synchronized (this) {
             instance = new Object();
          }
       }
    }
  }
  return instance;
}

There are rules which prevent the compiler to move lines inside a synchronized block out of the block. But there is no rule which forbids to move lines inside the synchronized block. Surprising, isn't it?

The lesson from this is: don't try to be too smart. Stick to this basic rules of the Java Memory Model which are: If there is something which can be accessed by multiple threads, then:
  • make it final, OR
  • make it volatile, OR
  • use the same monitor to coordinate access to the data

Hard Side of Live (Hardware)

Until now I talked only about theoretical guarantees the JMM offers. This gives the freedom to the Java developer to code against one memory model. Remember: Java is designed to run everywhere. If Java wouldn't offer something like a JMM, the developers would need to bother themselves with all the difficulties and pitfalls of different architectures. But how is the JMM applied to a specific architecture, let's say: x86?

To recapitulate: we were concerned with 'visibility' of updated memory values. We talked about threads not seeing new values, because they still use their (old) cache. The cure in terms of JMM was to use volatile or synchronized.

A lot of people think when volatile is written to, or when a synchronized block is left, CPU caches are flushed, so updated values will be read. But in fact there is no CPU operation like "flush the cache". All modern x86 CPUs try very hard to keep the CPU caches transparent and make the memory appear consistent to the developer. They do this by implementing cache coherency. So memory writes are automatically detected and updated in all caches. And: this also only applies to multi processor systems, or processors having a memory cache for each core. For a single CPU, single core system each thread ultimately sees the newest values.

So does this mean for x86 architecture the JMM is not necessary? Does it add unnecessary synchronization statements or is it NOPed out (replaced by "no operation" instructions) when compiled? Far from it! Even with cache coherency the JMM is required. Required to:
  • guarantee read/write order
  • atomicy when writing/reading values which cannot be written/read atomically
  • get "caches" in line you probably even didn't think of: registers
  • offer guarantees even in case of optimizations applied on top of the memory cache.

Memory Access Reorderings

Memory access can be reordered by multiple instances. It can be reordered by the compiler. This was already noted earlier. There are some restrictions to reordering introduced by the JMM, but compilers still have a lot of freedom to change the execution order compared to program order (as in the source). So when we have code like

x = 3;
written = true;

nothing prevents the compiler to reorder these statements making this code fail:

while (!written) wait();
assert x == 3;


But even when the compiler did not change the order, the CPU might change it. Modern CPUs try to parallelize as much as possible. When code is executed in parallel it may appear to run out of order. Take for example a floating point calculation, a store of the calculation result to memory, and a subsequent load of another variable from memory:

float f2 = f1 * 4.38473723;
if (x == 3) { ... }

The load of x might be executed in parallel to the floating point calculation. So the value of x might be read from memory while f2 is still not written to memory yet.

Atomic Writing/Reading of Values

Some Java datatypes can be written and read by the processor in one operation. For example a int on a 32 bit system. While other datatypes require multiple operations. For example a long (64 bit) on a 32 bit system. Having two operations to write a value allows other processors to observe a half written (thus inconsistent) value. For variables declared volatile Java needs to make sure the variable appears to be written and read atomically.

Registers

There are more types of "cache" than the usual CPU memory cache everyone thinks of when someone says "cache". The Java compiler could optimize code by moving variables temporary to CPU registers. This can be considered a cache too. Take this code:

for (int i = 0; i < 1000; i++) {
 j = j + 10
}

It is almost certain that the variable i will only exist in CPU registers. It's also very likely that j will be loaded to a CPU register at the beginning of the loop, and only written back to memory when the loop finishes. No other threads will be able to observe the intermediate steps applied to j. If one needs to make sure other threads will observe the changes, he needs to tell this explicitly to Java.

Optimizations of the Cache

In their effort to speed up CPU memory access CPU designers applied even optimizations to the cache, which is actually a optimization on itself. There are so called store buffers. They are used to queue stores to memory applied by the processor. Using those the processor can continue it's work without to have to wait for the store operation to complete. With store buffers in use, a couple of things can happen:
  • The store operation itself is delayed.This means some writes/reads may appear out of order.
  • There are no guarantees in which order values in the store buffer are going to be written to memory. It's possible that, if two variables lie next to each other in memory, they are written in one operation, even if there were other store operations in between.
And there are invalidation queues. A little background on this: One way how CPUs implement cache coherency is to use the MESI cache coherency protocol. MESI stands for Modified Exclusive Shared Invalid and names the states cache entries may have. When a CPU needs to modify a variable it sends a invalidation message to other CPUs. The others mark the entries in their caches as invalid (if they store the entry in their cache at all). The modifying CPU needs to wait until all CPUs confirmed the invalidation message. This takes time. A lot of time in CPU processing terms. So invalidation queues were introduced. Each CPU immediately acknowledges a invalidation message and stores a entry in its invalidation queue. The queue is processed later on. This means there is some time between a invalidation message and the message beeing applied in all caches. So it's possible for CPU0 to process it's store buffers and update all values in memory, while CPU1 still has not yet processed the invalidation queue. So CPU1 could read a old value for a variable from it's cache while the invalidation queue is still not yet processed.

So what does Java do to guarantee consistency in all those cases? Java utilizes so called memory barriers. In simple terms a memory barrier forces those queues (store buffers, read buffers, invalidation queue) to run dry before execution can continue. When a volatile variable is written, a single cache entry is invalidated and the invalidation queue and store buffers are processed.

Lessons we learned

Consistency and performance are conflicting. ;) But you knew this already, right? There are a lot of subtle things going on. And the magic spell for the Java developer to handle all this is the Java Memory Model. The JMM is a nice thing to rely on, facing the amount of architectures the code could be executed on.

Donnerstag, 6. Februar 2014

Diagnose frame skips and stutter in DirectX applications

(Although I'll be writing specifically about applications using DirectX for rendering, the general concepts can also be applied to applications using OpenGL.)

User experience of games and multi media applications is highly bound to a feeling of smoothness. This smoothness feeling is quickly lost when
  • the application does not respond fast enough to input,
  • animations stutter or
  • audio output is distorted.
Developers have to try hard so none of those three appears. But when they appear, how to find out what's responsible for it? In this article I'll show a way to diagnose frame skips.

Tools

Your Swiss Army knife for diagnosing performance problems on Windows 7 and newer is the Performance Toolkit which is part of the Windows SDK. In this article I'll use Windows Performance Recorder (WPR, wprui),  Windows Performance Analyzer (WPA) and GPUView.

The second step will be to record a event trace using WPR. But for a clean and nice event trace with as little back ground noise as possible, the first step is to get a clean Windows instance. This means to reboot the computer and end all processes which are not vital for the operation of the OS. Start WPR (wprui, not the command line tool), select "First level triage", "CPU usage", "GPU activity", "Desktop composition activity", "Audio glitches", "Video glitches" from the profiles. Select detail level "Verbose" and log to memory. Start your application. Start the event recording. Wait a little bit and let WPR record the "normal" state of your application. Then make a frame skip or wait until it appears on it's own. Depends of the nature of your frame skip problem. If you realize that the frame skip does not appear any more... the processes you killed may be a hint. Repeat the steps adding one process after another until the frame skipping appears again. Save the recorded trace.

Different Types of Problems

There are many reasons why your application may experience a frame skip:
  • Application CPU load: your application is heavily CPU dependent. The CPU is not able to process the work required between two vsyncs (16ms for 60Hz).
  • Application GPU load: your application creates a lot of GPU load (usually shaders processing) so the GPU is not able to process the work between two vsyncs.
  • System CPU load: background processes occupy a big chunk of CPU time leaving your application insufficient CPU time.
  • System GPU load: similar as previous but this time GPU releated.
  • Failing to process CPU and GPU work concurrently: GPU and CPU are able to work concurrently. If your application waits for the vsync, after finishing the last frame, CPU time is wasted, which is available during GPU processing.
  • Bad vsync synchronization: This is similar to the previous one. If you're synchronizing to vsync in a bad way (and there are a lot ways to get it wrong) you're application wakes up too late after the last vsync, leaving not enough time until the next vsync to process the work required to construct the next frame.
  • Locks: either locks in your application, or system wide locks, may block your application and make it skip a frame or two.
  • System / driver bugs: this is the nastiest way to loose frames. It's possible for the OS or graphics driver to have bugs which are triggered by your application and which lead to frame losses
I'll omit the last point, because there's usually nothing you can do about it. Most of the time the reason for your frame loss will fall into one of the other categories.
All these types of problems can be made visible using GPUView or the more versatile WPA (Windows Performance Analyzer). Load your recorded trace in GPUView. Matt's Webcorner has a very nice introduction to GPUView. Read it before you continue here.

Application CPU Load

If the CPU sits all the time in your application's thread lanes and the 'present' GPU package comes too late for the vsync, you're affected by this kind of problem. See section "Large CPU Delay - Dalaran" in Matt's introduction to GPUView for screenshots how this looks like in GPUView.
Once you confirmed you're suffering from this problem, you can switch to WPA and have a look into the "CPU Usage (Sampled)" view to get a hint where your application spends the most time. Every other profiler will aid you on finding bottlenecks in your code too.

Application GPU Load

See section "Large Render Time - Mothership Cloaking" in Matt's GPUView introduction for screen shots how this looks like. Diagnose this deeper is harder than CPU load. The GPU profiler industry sector is not so mature as the one for CPU profilers. Still, there are couple of tools which are available. And of course there's always "ninja debugging".
  • NVIDIA PerfKit: If you're the owner of a graphics card with a NVIDIA GPU, those tools might help you to get down to the core of the problem.
  • AMD GPU PerfStudio 2
  • AMD GPU ShaderAnalyzer
  • Intel Graphics Performance Analyzers
  • gDEBugger: for OpenGL applications
  • Ninja debugging: cut away everything. Add the parts back again, one after another, and measure the performance between the steps. When you identified a part responsible for a big chunk of GPU work, cut it further down and repeat.
 

System CPU Load

If you see the CPU sitting in the lanes of other processes then your's, you know you need to get rid of them.

System GPU Load

No so common. But possible. If the graphic card queue is full but not with packets of your process, check which process issued them.

Failing to process CPU and GPU work concurrently

If your application has a lot of CPU work to do, you'd better use every bit of CPU time available. If you rely on the 'present' command to block and to wake up your process once the vsync occured, you're not using important milliseconds of CPU. I'll cover the topic on how to synchronize to vsync without relying on blocking 'present' command in a later article.

Bad vsync synchronization

If you try to not rely on blocking 'present' command and do it wrong, it won't be any better than relying on 'present'. I'll cover this in the same future article as the previous topic.

Locks

It's possible you're your own enemy, if you try to do network or file system operations in the same thread you do the graphic stuff. But it's also possible that you avoided those obviously blocking APIs but your application still was blocked by the system. If you see that your graphics thread wakes up too late after vsync to do it's job, you need to analyse what it was waiting on. The second part of this article will explain such a situation in detail.


Blocked by the System

Let's have a look at a simple application which does some basic DirectX operations. There is not much CPU load. There is little GPU load. Usually the applications runs at constant 60ftps. But from time to time it skips a frame. I recorded a event trace and loaded it in GPUView. First I have to find the position in the trace where the frame skip occurs. There's a nice short cut for this. Locate the row with your application's process and enable the 'Present Chart' (Charts > Toggle Present Chart). Have a look in the Latency lane and watch out for spikes:

I select the spike and press CTRL-Z to zoom into selection. Now I enable vsync events (F8) and disable the Present Chart again. The result looks like this:
You see three horizontal lanes. The first is the graphic queue of the process. The next two are the two threads running in the application. There are five frames in the screen shot, the blue lines being the vsync events. Three frames look healthy. Little work in the threads, a couple of graphic command packages quickly processed. But in one of the frames the present package (cross-hatched) is kept unusually long in the process queue. Usually the command packets are moved from the process queue to the graphic card queue by the system video scheduler when there's room in the hardware queue. Here's a screen shot of the same time period (I increased the zoom a little bit) including the graphics queue.
In the first frame on this screen shot the present packet is moved nearly instantly into to the hardware queue and is processed quickly. But in the next frame it remains in the process queue for some reason and is moved and processed not until the third frame.
The video scheduler thread is hosted by the System process. Here's a "healthy" frame zoomed in to show about 3ms after the vsync event.
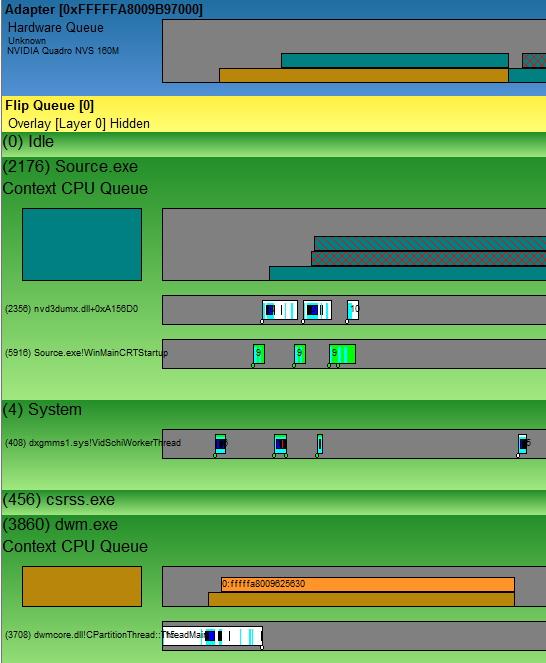
You see the hard ware lane, the test application "Source.exe", the System process and the Desktop Window Manager (dwm.exe) process. The name of the visible thread in the System process is already a hint to what it does: "VidSchiWorkerThread". If you look accurately you see how this thread moves the graphic command packets. Shortly after dwm.exe added a packet to it's queue the video scheduler wakes up and moves the packet to the hardware lane (the packet remains in the process lane until its completely processed by the hardware). The video scheduler goes to sleep again and wakes up when Source.exe added a command packet to it's queue. It's moved to the hardware queue nearly immideately. Then again, it wakes up when the 'present' packet was added to the process queue. But the hardware queue currently contains already two packets so the scheduler goes to sleep again and wakes up as the GPU finished the dwm.exe packet. The 'present' packet is moved to the GPU queue.

GPUView is able to display the stack of the thread at the time when it was woken up. If the zoom rate is high enough small handles appear at the bottom of the squares denoting the CPU time slices used by the threads. Clicking the handle of the first CPU slice of the System thread, a window will appear displaying a lot of information and a stack trace at the bottom of the window. (Assuming the symbol path was set up correctly (Options > Symbol Path...). You can set the symbol path to something similar to this: srv*C:\Symbols*http://msdl.microsoft.com/download/symbols; and enable "Use Symbol Server".)
The stack trace of the video scheduler waking up for the first time is (zero is the youngest stack frame, the invocation order is from bottom to top):
0 0xFFFFF80003686F97 ntoskrnl.exe!SwapContext_PatchXRstor+0x103 
1 0xFFFFF80003686A8A ntoskrnl.exe!KiSwapContext+0x7A 
2 0xFFFFF800036795F2 ntoskrnl.exe!KiCommitThreadWait+0x1D2 
3 0xFFFFF800036860EA ntoskrnl.exe!KeWaitForMultipleObjects+0x26A 
4 0xFFFFF880043CA3F8 dxgmms1.sys!VidSchiWaitForSchedulerEvents+0x1BC 
5 0xFFFFF8800439D2D2 dxgmms1.sys!VidSchiScheduleCommandToRun+0x1DA 
6 0xFFFFF880043C9FF6 dxgmms1.sys!VidSchiWorkerThread+0xBA 
7 0xFFFFF800039202EA ntoskrnl.exe!PspSystemThreadStartup+0x5A 
8 0xFFFFF800036748E6 ntoskrnl.exe!KiStartSystemThread+0x16 
Everything above "KeWaitForMultipleObjects" can be ignored. Just below this call we see what the thread was waiting for: "VidSchiWaitForSchedulerEvents". And it was invoked by "VidSchiScheduleCommandToRun". I checked the stack traces of the three successive wake ups. Two times it was the same stack trace. But the last time the thread was waiting for something different:
0 0xFFFFF80003686F97 ntoskrnl.exe!SwapContext_PatchXRstor+0x103 
1 0xFFFFF80003686A8A ntoskrnl.exe!KiSwapContext+0x7A 
2 0xFFFFF800036795F2 ntoskrnl.exe!KiCommitThreadWait+0x1D2 
3 0xFFFFF800036860EA ntoskrnl.exe!KeWaitForMultipleObjects+0x26A 
4 0xFFFFF880043A10B5 dxgmms1.sys!VidSchWaitForEvents+0xF5 
5 0xFFFFF880043CFE79 dxgmms1.sys!VidSchWaitForCompletionEvent+0x139 
6 0xFFFFF8800439D2AA dxgmms1.sys!VidSchiScheduleCommandToRun+0x1B2 
7 0xFFFFF880043C9FF6 dxgmms1.sys!VidSchiWorkerThread+0xBA 
8 0xFFFFF800039202EA ntoskrnl.exe!PspSystemThreadStartup+0x5A 
9 0xFFFFF800036748E6 ntoskrnl.exe!KiStartSystemThread+0x16 
This time it was waiting for completion ("VidSchWaitForCompletionEvent"). As already said the thread waits for graphic command packets to appear in process queues and moves them to the GPU queue. When the GPU queue is full, it waits until there's room.

Next I want to see how the bad frame looks like:
The VidSchiWorkerThread was woken up six times in this frame. It woke up for the first time as dwm.exe added a packet to it's queue. It also started adjustment of it's own priority for some reason ("VidSchiAdjustWorkerThreadPriority"). When it was woken up for the second time, it finished the priority adjustment and went to sleep again. The third time it was woken up when Source.exe added a packet to it's queue. It finished it's work and went to sleep again. The fourth time it was woken up by the new 'present' packet. But the GPU queue was full so it went to sleep again, this time waiting for completion of the packet being processed by the GPU. Just like in the "good" frame. But when it woke up for the fifth time, it did not move the present packet to the GPU queue. Even though there was room for a new packet it went to sleep again waiting for something. The stack trace of the sixth packet shows what it was waiting for:
0 0xFFFFF80003686F97 ntoskrnl.exe!SwapContext_PatchXRstor+0x103 
1 0xFFFFF80003686A8A ntoskrnl.exe!KiSwapContext+0x7A 
2 0xFFFFF800036795F2 ntoskrnl.exe!KiCommitThreadWait+0x1D2 
3 0xFFFFF800036860EA ntoskrnl.exe!KeWaitForMultipleObjects+0x26A 
4 0xFFFFF880043A10B5 dxgmms1.sys!VidSchWaitForEvents+0xF5 
5 0xFFFFF880043CFE79 dxgmms1.sys!VidSchWaitForCompletionEvent+0x139 
6 0xFFFFF880043CB82B dxgmms1.sys!VidSchiWaitForEmptyHwQueue+0x8F 
7 0xFFFFF880043CA19F dxgmms1.sys!VidSchiHandleControlEvent+0x3B 
8 0xFFFFF880043CA47A dxgmms1.sys!VidSchiWaitForSchedulerEvents+0x23E 
9 0xFFFFF8800439D2D2 dxgmms1.sys!VidSchiScheduleCommandToRun+0x1DA 
10 0xFFFFF880043C9FF6 dxgmms1.sys!VidSchiWorkerThread+0xBA 
11 0xFFFFF800039202EA ntoskrnl.exe!PspSystemThreadStartup+0x5A 
12 0xFFFFF800036748E6 ntoskrnl.exe!KiStartSystemThread+0x16
It's waiting for an empty GPU queue ("VidSchiWaitForEmptyHwQueue"). And "VidSchiHandleControlEvent" was the reason it started to wait for a empty GPU queue. So there arrived some kind of a control command which made the scheduler clear the GPU queue. But this still was not enough. The 'present' package remained in the software queue until the end of the frame. Just after the next vsync the scheduler thread wakes up:
and I can see in the stack trace what it was waiting for the frame through:
0 0xFFFFF80003686F97 ntoskrnl.exe!SwapContext_PatchXRstor+0x103 
1 0xFFFFF80003686A8A ntoskrnl.exe!KiSwapContext+0x7A 
2 0xFFFFF800036795F2 ntoskrnl.exe!KiCommitThreadWait+0x1D2 
3 0xFFFFF800036860EA ntoskrnl.exe!KeWaitForMultipleObjects+0x26A 
4 0xFFFFF880043A10B5 dxgmms1.sys!VidSchWaitForEvents+0xF5 
5 0xFFFFF880043CFE79 dxgmms1.sys!VidSchWaitForCompletionEvent+0x139 
6 0xFFFFF880043CB91A dxgmms1.sys!VidSchiWaitForDrainFlipQueue+0x92 
7 0xFFFFF880043CA1B0 dxgmms1.sys!VidSchiHandleControlEvent+0x4C 
8 0xFFFFF880043CA47A dxgmms1.sys!VidSchiWaitForSchedulerEvents+0x23E 
9 0xFFFFF8800439D2D2 dxgmms1.sys!VidSchiScheduleCommandToRun+0x1DA 
10 0xFFFFF880043C9FF6 dxgmms1.sys!VidSchiWorkerThread+0xBA 
11 0xFFFFF800039202EA ntoskrnl.exe!PspSystemThreadStartup+0x5A 
12 0xFFFFF800036748E6 ntoskrnl.exe!KiStartSystemThread+0x16 
The control command required even the flip queue to run completely dry. It looks like it was some kind of "flush" GPU command. But what did request this flush? In the screen shots above there was a collapsed process (csrss.exe) which I made visible for the next screen shot. It's the beginning of the bad frame again:
You see that csrss.exe executed something before the video scheduler started to flush the GPU. Unfortunately I can't tell from this CPU time slice what csrss.exe did. The event trace contains only the stack of when the thread woke up. And that didn't reveal anything about what csrss.exe was about to do. If I was lucky the sampled stack collector was active at exactly this time point so I'd see the stack trace of csrss.exe in the "CPU Usage (Sampled)" in WPA. But I was not lucky. The information I was looking war was in the next CPU time slice of csrss.exe which also woke up after the next vsync:
When I clicked the small handle of the csrss.exe CPU time slice GPUView showed me that the System video scheduler thread did ready the csrss.exe thread. The small white triangle does indicate this. In other words: the video scheduler did unlock something what the csrss.exe thread was waiting for (to learn more about wait analysis read this great article by Bruce Dawson: Xperf Wait Analysis–Finding Idle Time). The video scheduler did this after the GPU flush completed, so csrss.exe was waiting for the GPU flush. And indeed the stack trace of csrss.exe contains the next hint:
0 0xFFFFF80003686F97 ntoskrnl.exe!SwapContext_PatchXRstor+0x103 
1 0xFFFFF80003686A8A ntoskrnl.exe!KiSwapContext+0x7A 
2 0xFFFFF800036795F2 ntoskrnl.exe!KiCommitThreadWait+0x1D2 
3 0xFFFFF8000368A99F ntoskrnl.exe!KeWaitForSingleObject+0x19F 
4 0xFFFFF880043CD132 dxgmms1.sys!VidSchiRequestSchedulerStatus+0x86 
5 0xFFFFF880043CE002 dxgmms1.sys!VidSchSuspendAdapter+0x32 
6 0xFFFFF880042D09A3 dxgkrnl.sys!DXGADAPTER::SetGammaRamp+0xFF 
7 0xFFFFF880042D0EA2 dxgkrnl.sys!DxgkCddSetGammaRamp+0x1BA 
8 0xFFFFF960006D5E75 cdd.dll!PresentWorkerThread+0xB09 
9 0xFFFFF800039202EA ntoskrnl.exe!PspSystemThreadStartup+0x5A 
10 0xFFFFF800036748E6 ntoskrnl.exe!KiStartSystemThread+0x16 
"SetGammaRamp" was the command which required the GPU to complete all the work in the queue (so it won't be affected by the change probably). But I still don't know which process told csrss.exe to execute this command. I don't see no more processes in GPUView. But this doesn't mean there are no more processes. GPUView does hide some processes which it find to be not relevant for the trace. I switch to WPA and load the same trace.

"SetGammaRamp" was a blocking call for csrss.exe. So maybe it did also block the process which called csrsss.exe. If it did, I would see the culprit wake up after csrss.exe with it's stack trace some where around a gamma ramp. I use GPUView to determine the time stamps where this all happened. Like the time when the the video scheduler woke up. In WPA I select the "CPU Usage (Precise) Timeline by Process" view. The precise CPU view contains stack traces of the threads when they wake up. Right click in the graph area and choose "Select Time Range...". Then right click "Zoom". The view zooms to the time range. Here's what I saw:
I saw the first slice of the system video scheduler thread (this was right after the vsync event); it readied csrss.exe. csrss.exe did some work and went to sleep for two times. It looks like csrss.exe readied either dmw.exe or flux.exe. I verified this by looking at the "ReadyingProcess" column in the tabular view (you can adjust the visible columns by clicking the cog icon in the graph head line right to the graph name). It looks like csrss.exe did ready both threads:
Examining the stack traces (don't forget to setup symbol path and tell WPA to load symbols (Trace->Load Symbols)) showed that dwm.exe was waiting for shared access to the graphical device to do some frame statistics. Looks harmless. flux.exe on the other hand, had this wake up stack trace:
(Note that WPA presents the stack traces the other way round as GPUView. The oldest frame is at the top and the youngest frame is at the bottom. So frames invoked lower frames.)
Bulls eye! So flux.exe told the system to set the gamma ramp. f.lux is a small back ground tool which adjusts the colour temperature of your screen according to sun rise and sun set times. This shows very nicely that one has to consider everything when analysing problems. Even though f.lux consumed no CPU and no GPU power it was responsible for the frame skip.


Montag, 27. Januar 2014

Is the Double-Check Idiom really *really* fixed?

The double-check idiom is a way to reduce lock contention for a lazy initialized thread safe class. Unfortunately it used not to work. Luckily it was fixed. But under which conditions is it to be considered fixed?

Preface: There is a magnificent article covering this topic: Double Check Locking by Bill Pugh et al.. This article tries to rephrase the facts from the linked resource in a simpler way. Anyone interessted in the deep core details should read the article by Bill Pugh et al.

When Java 1.4 was the most recent release the so called Double-Check Idiom was considered broken. Due to the Java memory model specifications it was not guaranteed to work as one would expect. This is the double-check idiom in it's pure form:
piblic class Boss {
  private String name;
  
  public Boss() {
    this.name = "";
  }
}

public class Company {
  private Boss boss = null;
  
  public Boss getBoss() {
    if (boss == null) {
      synchronized (this) {
        if (boss == null) {
          boss = new Boss();
        }
      }
    }
    return boss;
  }
}
There are two major reasons why this could fail: 1. operation reordering; 2. memory caches.

Operation Order:
The Java memory model guarantees that all memory operations will be finished before the synchronized block is left. But it doesn't say anything about the order of the memory operations inside the synchonized block. A compiler might change the order of memory operations. If the constructor of Boss is inlined, the assignment of boss field (pointing to memory holding boss instance) could be executed before the instance fields of the Boss class are assigned by the constructor code. This means a concurrent thread could see boss!=null while the initialization is still not finished.

Memory Caches:
Each thread may have it's own local cache of the main memory. So even if the initializing thread did finish all memory write operations, a concurrent thread might see the new value of the Company.boss field but the old (uninitialized) memory values for the Boss class fields. This is what the Java Language Specification (Java 1.7) says about memory effects of the synchronized block:

JLS 17.4.4. Synchronization Order
... An unlock action on monitor m synchronizes-with all subsequent lock actions on m (where "subsequent" is defined according to the synchronization order). ...

So it guarantees that everything what thread A did before it left the synchronized block will be visible to thread B when it enters a synchronized block which locks on the same mutex. Note that it doesn't state anything about what is visible to threads which do not enter a synchronized block! So the changes from the double-checked idiom might be visible, might be partially visible or might be not visible to other threads.

Changes to the Java Memory Model in 1.5

Java 1.5 implements a more recent memory model specification. The modification which is interesting in this context is the change to access to volatile variables. The read or write of a volatile variable is not allowed to be reordered with respect to any previous or following read or writes. This means the compiler is not allowed to reorder the write of Company.boss field if it is declared volatile.

The fixed example from above would look like this:
public class Company {
  private volatile Boss boss = null;
  
  ....
}
Concluding: the double-checked idiom was really really broken before Java 1.5. It is really really fixed with Java >= 1.5 only when the the field being checked in the double-checked idom is declared volatile. If it is not, it's still broken.

Dienstag, 21. Januar 2014

Java polymorphism and equals()

Let's start by having a small introduction. The mother of all Java classes - Object - does define a equals() method, which is meant to return true if the passed instance is equal to the current instance. The default implementation is limited to comparing references. So it will only return true when the current and the passed object are the same. The equals() method is meant to be overridden by extending classes with meaningful logic. The implementation has to obey some requirements (from javadoc on Object.equals()):
The equals() method guarantees that...

  • It is reflexive: for any non-null reference value x, x.equals(x) should return true.
  • It is symmetric: for any non-null reference values x and y, x.equals(y) should return true if and only if y.equals(x) returns true.
  • It is transitive: for any non-null reference values x, y, and z, if x.equals(y) returns true and y.equals(z) returns true, then x.equals(z) should return true.
  • It is consistent: for any non-null reference values x and y, multiple invocations of x.equals(y) consistently return true or consistently return false, provided no information used in equals comparisons on the objects is modified.
  • For any non-null reference value x, x.equals(null) should return false.

Quite a bunch. Luckily those requirements are often easy to achieve. Let's create a simple class and equip it with a equals method.

A Drink

public class Drink {
  private final int size;

  public Drink(final int size) {
    this.size = size;
  }

  @Override
  public boolean equals(final Object obj) {
    if (!(obj instanceof Drink)) return false;
    return equals((Drink) obj);
  }

  public boolean equals(final Drink other) {
    return this.size == other.size;
  }
}
This equals() implementation obeys all the requirements above. And I added a convenience method with the exact type. Note that equals(Drink) does overload Object.equals(Object) but it does not override it! The difference between those two will be important later.

A Drink? A Coffee? A Coke?

Now let's introduce polymorphism. We add two classes Coffee and Coke which extend the Drink class:
public class Coffee extends Drink {
  private final int coffeine;

  public Coffee(final int size, final int coffeine) {
    super(size);
    this.coffeine = coffeine;
  }

  @Override
  public boolean equals(final Object obj) {
    if (!(obj instanceof Coffee)) return false;
    return equals((Coffee) obj);
  }

  public boolean equals(final Coffee other) {
    if (!super.equals(other)) return false;
    return coffeine == other.coffeine;
  }
}

public class Coke extends Drink {
  private final int sugar;

  public Coke(final int size, final int sugar) {
    super(size);
    this.sugar = sugar;
  }

  @Override
  public boolean equals(final Object obj) {
    if (!(obj instanceof Coke)) return false;
    return equals((Coke) obj);
  }

  public boolean equals(final Coke other) {
    if (!super.equals(other)) return false;
    return sugar == other.sugar;
  }
}
The equals() methods are implemented here in a similar way. Everything looks fine, doesn't it? Let's see how the equals() methods behave:
final Drink drink = new Drink(15);
final Drink secondDrink = new Drink(15);

System.out.println("drink.equals(secondDrink): " + drink.equals(secondDrink));
System.out.println("secondDrink.equals(drink): " + secondDrink.equals(drink));

final Coffee coffee = new Coffee(15, 3);
final Coke coke = new Coke(15, 42);

System.out.println("coffee.equals(drink): " + coffee.equals(drink);
System.out.println("drink.equals(coffee): " + drink.equals(coffee));
System.out.println("coke.equals(coffee): " + coke.equals(coffee));
What’s the output? Your brain might tell you something like this:
drink.equals(secondDrink): true
secondDrink.equals(drink): true
coffee.equals(drink): false
drink.equals(coffee): false
coke.equals(coffee): false
But what’s the actual output? This:
drink.equals(secondDrink): true
secondDrink.equals(drink): true
coffee.equals(drink): true
drink.equals(coffee): true
coke.equals(coffee): true
Wow! What's happening? drink.equals(coffee) is passed a parameter of type Coffee. The best method match for this type is Drink.equals(Drink). This method does only compare the size field. Since it's equal it returns true. coffee.equals(drink) is passed a parameter of type Drink. The best method match for this type is.... Drink.equals(Drink)! Not Coffee.equals(Object)! So again only the size field is compared. The same goes for coke.equals(coffee): Drink.equals(Drink) is invoked.
First lesson: it’s a bad idea to implement convenience public equals() methods with different types than Object. Or in other words: do not overload equals(), override it.

Now let’s “fix” this problem by making the overloaded methods private. What will be the output this time? This:
drink.equals(secondDrink): true
secondDrink.equals(drink): true
coffee.equals(drink): false
drink.equals(coffee): true
coffee.equals(coke): false
Still not quite the output we're expecting. What’s happening now? When coffee.equals(drink) is invoked, the Coffee.equals(Object) method is executed, Drink instance is checked against “instanceof Coffee” and this evaluates to false. But when we invoke drink.equals(coffee) the equals() implementation in Drink is executed and the passed instance is checked against “instanceof Drink”. Since Coffee is a extension of Drink, this evaluates to true.

Not all Drinks are Coffees

So is polymorphism broken in Java? Not quite. It seems like instanceof is not the check you should use per default in equals(). It's sometimes important, we'll see in a minute, but usually what you'd like to do is to use Object.getClass() and compare the class of the passed instance to the class of the current instance:
public class Drink {
  ...

  @Override
  public boolean equals(final Object obj) {
    if (obj == null) return false;
    if (this.getClass() != obj.getClass()) return false;
    return equals((Drink) obj);
  }

  private boolean equals(final Drink other) {
    return this.size == other.size;
  }
}

// changes in Coffee and Coke similar
As specified by documentation of getClass(), it is guaranteed to return the same Class instance for the same class. So it is save to use the == operator. Note that obj.getClass() is compared against this.getClass() and not against Drink.class! If we'd compare against the hard coded class super.equals() invocations from extending classes would always fail for non Drink instances.

Second lesson: use Object.getClass() in equals() if unsure. Only use instanceof if you know what you do. ;)

Instanceof

Now when would one want to use instanceof in equals() implementations? The semantics of equals() implementations are actually up to you (as long you follow the restrictions stated at the beginning). In my example above I wanted to have Drink!=Coffee!=Coke. But that's just a definition thing. Sometimes you want to have a set of types behave like one type. The Java class library does this for lists and maps for example. A TreeMap and a HashMap are considered equal if they contain the same objects. Even though a TreeMap has an element order which a HashMap does not have. The types achieve this by having a AbstractMap class implement a equals() method which checks against "instanceof Map" and checks only Map properties. All extensions of AbstractMap do not override (and do not overload) equals().

One more thing

Don't forget to implement hashCode() if you override equals(). Both methods have a tight relationship. Whenever a.equals(b) returns true, also a.hashCode() has to be equal to b.hashCode()!

Diagnose OpenGL Performance Problems

I stumbled upon an interesting OpenGL slow down issue on stackoverflow.com: Curious slowdown in opengl when using instanced rendering. The author created a program which would render 20 x 20 x 20 cubes in two different ways: indexed drawing and instanced drawing. When using indexed drawing performance seemed fine. But after switching to instanced drawing it broke down. But only in a special case. As described by the question author: when the camera position changed the performance changed from decent (distance at 40) to horrible (distance at 0). This sounded strange.

First step to find a problem is to reproduce it. So I copied the example code, fixed small compiler issues, and created shaders which were referenced but missing in the question example code. They are simple so I guess the author used similar shaders.

Fragment shader for both drawing methods:
#version 330 core

in vec3 fragmentColor;
out vec3 color;

void main() {
  color = fragmentColor;
}
The vertex shader for basic indexed drawing:
#version 330 core

layout(location = 0) in vec3 vertexPosition;
layout(location = 1) in vec3 vertexColor;

out vec3 fragmentColor;
uniform mat4 MVP;

void main(){
  gl_Position = MVP * vec4((vertexPosition), 1);
  fragmentColor = vertexColor;
}
The vertex shader for instanced drawing:
#version 330 core

layout(location = 0) in vec3 vertexPosition;
layout(location = 1) in vec3 vertexColor;
layout(location = 2) in vec3 translation;

out vec3 fragmentColor;

uniform mat4 MVP;

void main(){
  gl_Position = MVP * vec4((vertexPosition + translation), 1);
  fragmentColor = vertexColor;
}
With those changes I was able to confirm the questions claim. The performance of the indexed drawing was fine. The performance of the instanced drawing method was horrible. It not only rendered extremely slowly it also stalled the whole computer. The cpu load was nearly at 0%. Since the program stalled the whole computer the bottleneck must have been either some kind of a system wide lock (either a software lock or hardware if form of a resource).

Next step was to create a system event trace file. This would not only tell me what the analysed program is doing but also how it interacts with the system. Windows 7 onwards has a very powerful event tracing system. The tools to create and analyse event traces are wprUI (Windows Performance Recorder) and wpaUI (Windows Performance Analyser). Both are part of the Windows 8.1 SDK. Here is a very nice blog if one wants to get down to details of performance analysing: randomascii.wordpress.com.

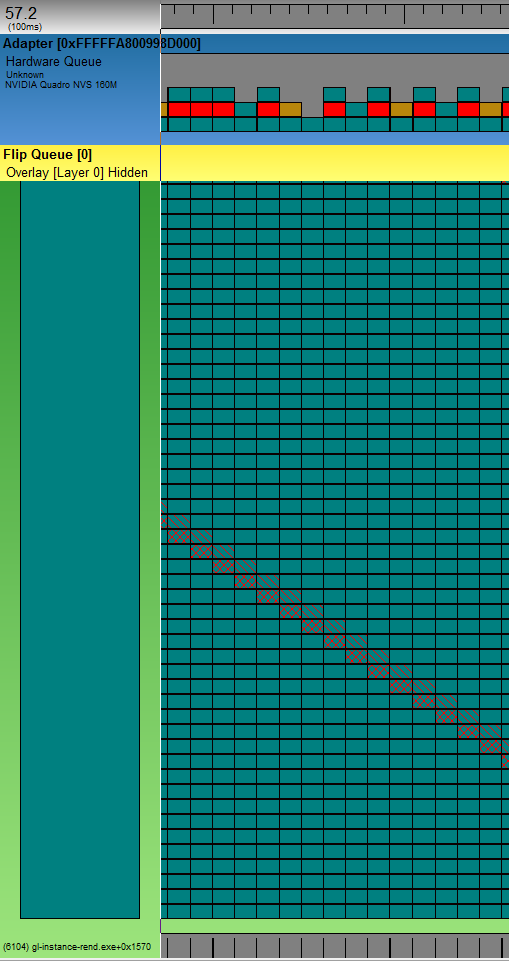
I enabled "GPU activity" and "Video glitches" profiles in wpr, recorded a session of the slow running program and opened it with GPUView. Also part of the Windows 8.1 SDK. The GPUView project site of Matt Fisher describes nicely how to read GPUView output. Here is a screen shot from GPUView's output generated from the recorded event trace:


The light green lane is the test process having enormous rendering problems. The darker green parts are GPU command packets queued up in the process. The gray strip at the bottom is the CPU time consumed by the process. Since you see only thin black lines means the process is hardly consuming CPU time. But it heavily uses GPU. At the top you see a ruler. One tick of the ruler is about 100ms. The top blue lane is the graphics card and the hardware queue of command packets. The dark green packets are packets from the test process which are moved from software to hardware when there is room in the hardware queue. So it takes the GPU around 100ms to process one dark green packet!
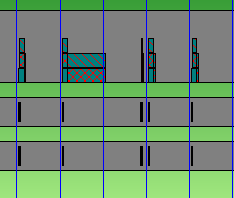
The red packets are from the idle process and the brown from the dwm.exe process. Don't get confused by the size of the red and the brown packets. One needs to get used to the presentation type of GPUView. The packet in the pottom row of the hardware queue is the packet being processed. This packet determines the width of the whole (!) column. When it's the turn of the red and the brown packet to be processed, they are so fast, that you never see them in the bottom row. Here's a screen shot zoomed in onto one of those red packets:


The ruler ticks are now 1ms. Once it's turn for the red packet to be processed, it finishes in less than 1ms.

So we found out that the GPU is the bottleneck. The application hardly uses CPU but it creates heaps of GPU command packets and each packet takes ages (in terms of GPU time) to be processed. The question is why.

The next step in finding a problem is to reduce the complexity of the test. Reduce it as far as possible. Sometimes it's easier to restart from zero and add complexity until the problem occurs. This is what I did. I recreated the program step by step. First it drew small numbers of cubes with indexed drawing and instanced drawing. Then I added more and more cubes. GPUView confirmed that the number of command packets increased along with cube count. This was expected. But the execution time for each packet was around 0.8-3ms depending on the camera position (how many cubes were visible) but independent of the drawing style! Indexed drawing and instanced drawing were equally fast.

So my rewrite reached the complexity of the original program without triggering the problem. I started to replace parts of the original program with parts from my program. After I replaced the lattice calculation I noticed a strange cube right in the center of the grid. The grid in the original program was aligned in a way that the camera would face the center of a cube:

But in my rewrite I placed the camera between the rows and colums:


The strange cube was there in both versions. But in my rewrite it got visible. The performance dropped when the camera moved towards this cube.

I continued replacing parts of the program until the problem disappeared. And also the cube disappeared! I reverted my last change and realized that it was a bug in the code triggering the problem, not some strange OpenGL behaviour. This is the buggy line drawing the cubes:
glDrawElementsInstanced(GL_TRIANGLES, sqIndice.size(), GL_UNSIGNED_INT,
 (GLvoid*) (0), latticePoints.size());
This is the line from my rewrite:
glDrawElementsInstanced(GL_TRIANGLES, indices.size(), GL_UNSIGNED_INT,
 (GLvoid*)NULL, gridCoordinates.size()/3);
glDrawElementsInstanced expects the count of instances (cubes) to draw not the count of array elements. So instead of drawing 8000 cubes as it was meant to it drew 24000 cubes. But that's not the whole story. ;)

Let's remember the vertex shader. For each instance it reads three float values from the latticePoints array and stores them in the vec3 translation variable. Since OpenGL tried to draw far more instances than the latticePoints array was able to supply (latticePoints contained 24000 float elements, but OpenGL tried to access 24000*3=72000 elements). So this out of bounds situation would usually create a illegal memory access. Luckily there are facilities which prevent a shader from crashing. So instead of a crash the shader just received zero values. translation was set to (0,0,0) so no translation happened. This is explanation for the mysterious cube in the center. Or more exactly: the 16000 mysterious cubes in the center.

But why did it only perform so horribly when the camera moved towards the center cube? The vertices of the 16000 additional cubes did not make it so worse. I did some testing to come up with the solution for this. The program hits the graphic card memory speed limit. How's this? Here is what happens: Each fragment (pixel) painted by OpenGL has to be transferred to the graphic card memory. OpenGL prevents the most paints by not painting invisible parts. The depth buffer is very good at this task. But how about identical objects on exactly the same position? Is the front face of cube 8001 concealed by the front face of cube 8002 which is on the same position? It looks like OpengGL thinks it is not. So it paints all front faces of all 16000 cubes in the center. When the cube is far away this are not many pixels. But as the camera moves towards the center the front face of the cube covers more and more pixels. When the calculation time for one frame drops to 500ms the cube is roughly 250x250 pixels big. Let's do some math:

250 * 250 = 62,500 - amount of pixels to draw for one cube front face
62,500 * 16,000 = 1,000,000,000 - pixels to draw for all 16,000 cubes in the center
1,000,000,000 * 3 = 3,000,000,000 - 3 bytes are transferred for each pixel
3,000,000,000 * 2 = 6,000,000,000 - so many pixel per second (we have 2fps)

That's a lot. Let's see what my graphic cart is able to handle. I'm using a notebook with a Nvidia Quadro NVS 160M. Those are the specs:
  • Memory clock: 700 MHz
  • Memory bus bandwidth: 64bit
  • Memory type: GDDR2, GDDR3
 
700,000,000 * 8 = 5,600,000,000 - That's the clock multiplied by the bus bandwidth

So the NVS160M is able to move 5,6GBytes per second (I'm ignoring the memory type here for simplicity). According to the calculation above the program moves about 6GBytes per second. Don't nail me down to the numbers! Everything is approximately! But this little calculation points out that the memory speed is clearly on it's limit. I did other tests to verify this. I moved the 16000 cubes a little bit on the z axis so the fist one would conceal the others. The frame processing time dropped drastically (16ms per frame)! Then I disabled the depth buffer which kept OpenGL from drawing unnecessary pixels. There it was again the horrible performance. Then I created another small program which would just paint two triangles to form a square and let OpenGL paint it thousand times. It surely took long. For a full screen windows of a size of 800x600 the GPU required 400ms per frame. Nearly no geometry. Only 6000 vertices!

So here's the culprit: graphic card memory speed. Or: the bug. Depends on the perspective. ;)

For the vigilant reader of the original stackoverflow.com question: the enabled multisampling surely took it's tall also.


Donnerstag, 16. Januar 2014

Extract one folder from a Subversion repository into a GIT repository including complete history

This task is so common that there are a lot of articles and howtos on the net. This is mere a collection of information snippets and links to further reading. This article focuses on extracting a specific folder from a Subversion repository. This requirement seems to be untypical. All references I found assume the Subversion repository contains only one projects (including its branches and tags). But if in your case you placed all your projects in one Subversion repository, this article will tell you how you detach one.

Subversion to GIT conversion is done by the git svn command and it's sub commands. Pass the repository folder to git svn clone, and the command will clone the complete repository and complete history from revision 1. If you pass the full path to your project to the command (it doesn't matter if you pass the path as part of the repository path 'git svn clone http://svnserver/repo/trunk/myproject' or as trunk parameter 'git svn clone http://svnserver/repo -T trunk/myproject') it will clone the history from the revision on when your project folder was created. It doesn't care if your project contains files which are older than the project folder. For example: you restructured your project; once you had three modules:

  • "module1"
  • "module2"
  • "module3"

Then you created a new project folder "new project" and moved the modules into this folder:

  • "new project/module1"
  • "new project/module2"
  • "new project/module3"

Using the command above will ignore the history of the modules which is older than the "new project" folder. Even using --follow-parent will not get you the history, since "new project" has no parent, it was newly created. Sad.

Now let's check out how we get the complete history. I found two ways:

  • remove everything uninteresting from Subversion repository, and purge it from history
  • clone completely to GIT and remove/purge the uninteresting parts in GIT
To accomplish the first approach you'd need to use svnadmin dump (since there is no way to delete revisions from Subversion) to rebuild a repository while filtering the uninteresting files. I choose to use the second approach. And here's how you do it.

Clone Subversion Repository
From Git and Other Systems - Migrating to Git:
git svn clone http://svnserver/repo/ --authors-file=users.txt --no-metadata my_project
If anything goes wrong during cloning (for example your network connection dies, or you see a "unknown user" message) fix the problem and continue the process by invoking
git svn fetch
Remove Uninteresting Parts from GIT Repository
After successfully cloning the svn repository, we'd like to shrink down the repository to the project we'd like to keep. Before we do this, we need to convert the repository to a bare git repository. Bare git repositories are the only ones which are allowed to be pushed to. From my_project/.git move everything one level higher, so .git subdirectory ends up empty. Delete the empty .git directory. Now edit my_project/config and change "bare" setting to "true". After completing this you'll have a bare repository and we can continue to filter it.
From git: shrinking Subversion import:
git filter-branch -d /dev/shm/scratch --index-filter \
  "git rm -r --cached -f --ignore-unmatch 'Old Project'; \
   git rm -r --cached -f --ignore-unmatch 'Some Temp Stuff'; \
   git rm -r --cached -f --ignore-unmatch 'One More Project'" \
  --prune-empty --tag-name-filter cat -- --all
(choose a different temp folder for the -d parameter when not running on a up to date Linux)
git rm expects top level names. So the command above will remove the folders "/Old Project/", "/Some Temp Stuff/", "/One More Porject/" and everything that's below. You can specify folders on a deeper level like this:
git rm -r --cached -f --ignore-unmatch 'trunk/Delete-This-Project'
This syntax to git rm does no substring matching (folder names have to be complete). After this run the GIT repository will only contain the project you're interested in, including the whole history (assuming the history of your project does not intersect with folders you deleted).

Reduce Size of GIT Repository
GIT tries really hard not to delete stuff you might still need. So filter-branch will not reduce the size of your repository on disk. To remove all the deleted bits and bytes you also have to (copied from Detach subdirectory into separate Git repository):
git for-each-ref --format="%(refname)" refs/original/ | xargs -n 1 git update-ref -d
git reflog expire --expire=now --all
git gc --aggressive --prune=now

That's it. If everything went fine your GIT repository will contain only the stuff you're interested in.